Malvern Panalytical Scientific Award 2023

Our 2023 Scientific Award is now open – and there’s a €5,000 prize for the best entry.
Entries close August 31st – you’ve still got time!

Case Study – Hyperspectral Imaging Fights Citrus Blight

Precision Ag Case Study

Hyperspectral Imaging Fights Citrus Blight

How can hyperspectral imaging make a difference to precision agriculture? Consider this example of a US project to inspect orange groves, looking for citrus blight disease, which used a Headwall Photonics’ Hyperspec® VNIR hyperspectral solution with an OEM camera mounted on a UAV.

VNIR hyperspectral imagery for valuable data quality

Citrus blight destroys the vitality of trees and can spread throughout the grove. One of the early signs of this disease is a byproduct secreted on the surface of the leaves. Inspection for this used to require a person climbing a ladder to inspect the top of each tree. More often, growers might not know of a problem until trees started dying.

With hyperspectral imaging, this can be seen 300-400 meters above the crops covering a large area quickly (mounted on UAVs), allowing quick action to eliminate the spread and minimise the destruction.

Had only multispectral sensing been employed, this level of detail would not have been available and the correct decisions would not have been taken. Crop loss due to disease, such as citrus blight, and inaction leads to the loss of millions of dollars and the loss of a whole season in many cases.

PAS is the exclusive distributor of Headwall’s range of industry-leading hyperspectral solutions, and customises them for the demands of specific applications.

Precision ag: Multi Spec Vs Hyperspec

What’s the difference between multispectral and hyperspectral?

Imagine we could safely view the world through the eyes of different creatures, enabling us to view infrared radiation, ultraviolet light and reflected electromagnetic energy*. Well, we can, with the use of multispectral and hyperspectral sensors.

Each technology is able to sense (“see”) outside the range of normal human vision. The difference is the number of bands and the narrowness of the bands.

Multispectral imagery generally refers to 3-10 wide bands, using a remote sensing radiometer.

Hyperspectral imagery consists of many more bands (hundreds or thousands) that are much narrower (10-20nm), using an imaging spectrometer.


Multispectral vs Hyperspectral Imagery Explained

Why does it matter for precision ag?

It’s a question of detail.

The more detailed the spectral information recorded by a sensor, the more information that can be extracted from the spectral signatures.

Hyperspectral sensors have much more detailed signatures than multispectral sensors and thus provide the ability to detect more subtle differences in aquatic and terrestrial features.

Consider this example about a US project to inspect orange groves, looking for citrus blight disease, which used a Headwall Photonics’ Hyperspec® VNIR hyperspectral solution with an OEM camera mounted on a UAV.

Citrus blight destroys the vitality of trees and can spread throughout the grove. One of the early signs of this disease is a byproduct secreted on the surface of the leaves. Inspection for this used to require a person climbing a ladder to inspect the top of each tree. More often, growers might not know of a problem until trees started dying.  With hyperspectral imaging, this can be seen 300-400 meters above the crops covering a large area quickly (mounted on UAVs), allowing quick action to eliminate the spread and minimise the destruction.


Precision ag: Multi Spec Vs Hyperspec 1

For precision ag, the more detail, the better.

Imagine flying over a property and looking down at fields of different colours and appearance. You might decide you know what is planted in each paddock, with accuracy dependent on how low you are flying.

With multispectral detection, you would certainly be able to see differences between various elements, such as a tree plantation versus another crop.

With hyperspectral capabilities, you will see individual trees and plants, and even the subtle differences in the EMR emitted by disease and soil moisture levels etc.

In its 2017-2019 Strategic Plan, the NSW Department of Primary Industries’ first goal is Innovation in primary industries to improve resilience and boost productivity.

There is no doubt that hyperspectral imagery is the most advanced precision ag solution to transform our analysis and optimisation of production, risk management, use of resources and reducing disease.


Talk to PAS about the possibilities for the use of hyperspectral solutions in your agricultural context.


  1. https://gisgeography.com/multispectral-vs-hyperspectral-imagery-explained/
  2. https://www.adimec.com/how-is-hyperspectral-imaging-advancing-agriculture/

Precision ag: a spectrometry revolution

Access sophisticated precision ag technology for accurate and innovative farm management

Precision ag is a critical remote sensing application with the potential to impact any aspect of society. The use of UAVs in agriculture has been well-documented but the value of high-end data collectors mounted on the UAV or other vehicle is transforming data into agricultural treasure!

Peter Drucker’s saying, ‘what gets measured, gets improved’, highlights the importance of robust analysis and interpretation of data.

With precision ag, high-value crops can be planted, cared for, and harvested with the help of spectral data that leads to better decision-making. As a result, spectacular crop yields and healthier foods are achievable outcomes – of enormous value where agricultural success is a life-saving or life-enriching necessity.

Hyperspectral image sensors also monitor irrigation levels, pesticide and fertiliser effectiveness, and spot the telltale signs of invasive and hard-to-detect diseases. The key is to recognise these signs early and often, which is why continual airborne monitoring allows for trend analysis throughout the season.

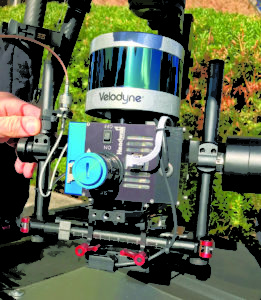
From UAVs and aircraft as well as tractors and other mobile machinery, researchers can determine stress levels and overall plant vitality using hyperspectral image sensors at the VNIR (400-1000nm) and SWIR (900-2500nm) spectral ranges. These sensors operate in a line-scanning fashion, requiring movement to occur as the sensor builds a data-rich image cube containing all the spatial and spectral information within the field of view. GPS and LiDAR, plus the post-processing task of orthorectification, stamp the image data precisely. The end result is high-quality data that farmers and agriculturalists can use to make smart decisions.


Precision ag in Australia / New Zealand

In the Australian agricultural setting, hyperspectral imaging’s ability to cover distances with accuracy is a boon to primary producers seeking to maximise yield, minimise waste and manage scarce resources.

PAS is the Australian / New Zealand home of a range of sensors and analysers for any aspect of precision ag, including the Nano-Hyperspec and Micro-Hyperspec sensors from Headwall Photonics and the FieldSpec NIR models from ASD.

Headwall supplements its sensors with the industry’s best airborne hyperspectral software package called Hyperspec III. The package includes all the tools necessary to set up the sensor for airborne operation, and tie that operation in with GPS and LiDAR data streams. The software also manages more than one sensor at a time, permitting a single pass using a VNIR and a separate SWIR sensor for example.

Headwall’s sensors feature aberration-correction for precise image data from edge to edge. This wide field of view is particularly beneficial for the new breed of small, lightweight UAVs that require flight-path optimisation. The wider the field of view, the fewer passes over a plot of land the UAV (or aircraft) needs to make.

The ASD FieldSpec® line offers a wide range of configuration options for both contact measurements (such as leaves or in a soil profile pit) and stand-off measurements (such as those needed to measure canopy reflectance). The FieldSpec uses a flexible fibre optic cable that can be used with many different accessories and configurations, giving researchers many options for acquiring critical data.

Speak to PAS about the breadth of solutions available to meet the needs of precision ag applications and many others as well.

Coastal Exploration and Spectral Vision

Coastal Exploration with Hyperspectral Imaging

Valued PAS customer, Queensland University of Technology is using Headwall’s hyperspectral sensors to examine the beautiful Ningaloo Reef on Western Australia’s mid-north coast which has received a very positive conservation rating from World Heritage Outlook.

When UNESCO reported last year that the world’s coral reefs were likely to disappear by 2100, many Australians saw the need for immediate action.  Thanks to cutting-edge analytical methods, scientific coastal exploration is well-advanced in understanding this critical problem.

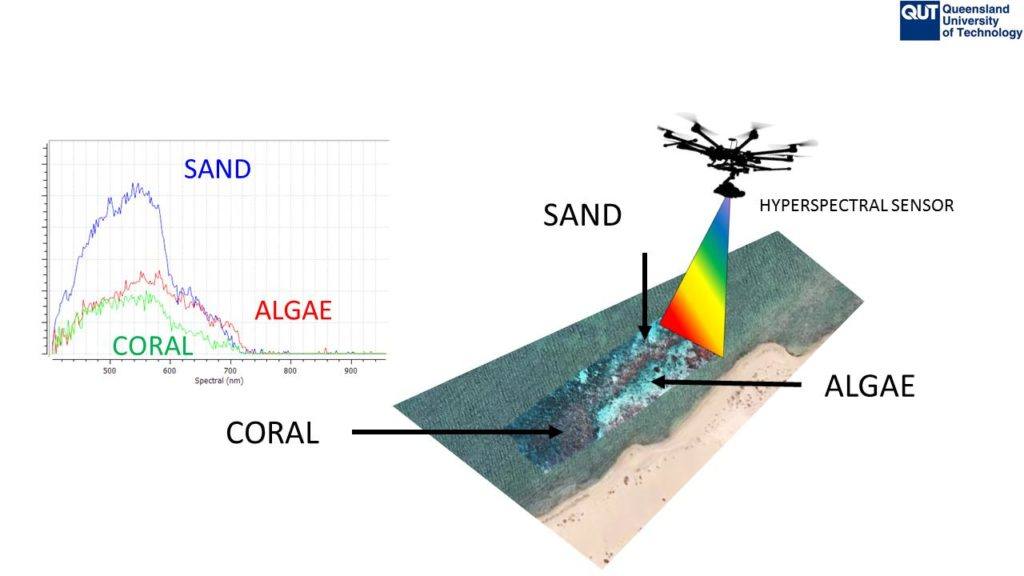
QUT scientists have clear vision of environmental changes in the coral, scanning 40 hectares of Ningaloo Reef, the largest existing fringing reef in the world, in only 30 minutes,100 metres above the surface, providing data to retain the health of the reef which hosts numerous marine species.

Advanced coastal exploration provides data to mitigate problems as they emerge

According to media coverage, lead researcher Associate Professor Felipe Gonzalez said the data would help build a fingerprint of the reef, showing coral, sand, algae and other species.

“If the coral is healthy or unhealthy it will show the difference,” he said.

A normal camera collects data in three colour bands: red, green and blue. This camera collects data in 270 bands which is far more than the human eye can see.

With its compact size and weight, the Hyperspec® sensor suits newer multi-rotor and fixed-wing UAVs, the preferred platform for mounting scientific sensing instruments due to their tactical efficiency.

Coastal Exploration beyond the limits of human vision

Hyperspectral sensors can see well beyond the limits of human vision, which runs to about 700 nanometers (nm). Many research projects demand the ability to see into the infrared ranges, often up to and beyond 2500nm.

With such precise vision, it is possible to detect the early signs of stress and disease on coral, vegetation and crops, with enough time to mitigate the problem. The use of imaging in the infrared ranges optimises scientific learning about coastal exploration, geological deposits and climatology and many other applications.

Sensors might collect literally hundreds of spectral bands per pixel, meaning the amount of useful data is enormous.

Speak to PAS and explore the possibilities of hyperspectral vision for your industry.

Images courtesy of Queensland University of Technology.

Eureka! Portable XRF and Gold Exploration

Eureka!

Modern gold exploration takes advantage of technological advancements including Portable X-ray fluorescence (XRF) analysers.

XRF sampling techniques in gold exploration map the distribution of gold and in particular, the various pathfinder elements associated with gold (silver, copper, zinc, nickel, mercury, arsenic and barium). It’s much easier to find the pathfinder elements than it is to find gold: once found, these elements are signposts helping to determine if gold is nearby.

While geophysical methods can be crucial for gold exploration, geochemical methods, including portable XRF solutions from Thermo Fisher, are the only ways to measure concentrations of gold and other associated elements.

In 1848, the discovery of a gold nugget in northern California sparked the California Gold Rush, the largest mass migration in U.S. history. Today, the idea of finding gold holds the same allure, with some modern-day prospectors in the Mother Lode region of California searching for gold the old-fashioned way, using buckets and classifiers, hog pans and cradles.

XRF a boon for modern gold exploration

A major difference between the prospecting of old and today’s multi-billion dollar industry is the scale: tonnes instead of bits and pieces.

Indeed, thanks to modern techniques like portable XRF and good old hard work, traditional gold workings have again produced significant finds, with discovery of large seams and previously unplumbed deposits.

According to a 2017 article published on abc.net.au, “Exploration for gold continues apace in every state and territory and the projects nearly all have one thing in common — the pioneer fossickers and gold panners who pushed wheelbarrows across the country in the first gold rush were there before them.

The article cites the example of the Commonwealth Project, located in the gold-rich district around Orange, NSW. Advanced exploration techniques have given formerly forgotten workings like Commonwealth a whole new ‘lease’ on life.

The gold hits at Commonwealth are part of the Lachlan Fold Belt, a 700 kilometre wide belt of gold and silver-bearing ores that run into Victoria,” the article says.

Two of the five largest gold nuggets in the world come from Australia

Many discoveries of large gold nuggets have been recorded, but few of the nuggets remain, having been melted down into gold bars or gold coins. Bullionstar.com profiles the top five largest ‘named’ gold nuggets still in one piece and on display to the public:

  • Pepita Canaã,  Brazil: The Pepita Canaã gold nugget was found in the Serra Pelada gold mining region of Brazilian state of Pará in 1983. It has a gross weight of 60.82 kgs and contains 52.33 kgs of gold, or 1682 troy ounces of gold. The nugget was purchased by the Banco Central do Brazil in 1984, and is now on display in the Museu de Valores do Banco Central in Brazil.
  • The Great Triangle, Russia: This gold nugget was found in the Miass area of the Russian Urals mountains in 1842. It has a gross weight of 36.2 kgs and a gold assay of 91%, meaning that it has a fine gold content of 32.94 kgs, or 1059 troy ounces of gold.
  • Hand of Faith, Australia: This 27.66 kgs gold nugget was found in Kingower, Victoria, Australia in 1980. It is the largest gold nugget ever found using a metal detector and contains 875 troy ounces of gold. The Hand of Faith nugget was purchased by the Golden Nugget Casino in Las Vegas, Nevada, and is currently on display in the casino lobby.
  • Normandy Nugget, Australia: This 25.5 kgs (820 ozs) gold nugget was found in 1995 in Kalgoorie, Western Australia. Assay analysis shows the Normandy Nugget to have a gold purity of between 80%  and 90%.It was purchased by Normandy Mining, which is now part of Newmont Gold Corporation, and is currently on display at the Perth Mint.
  • Ironstone’s Crown Jewel, California: This nugget is a single piece of crystalline leaf gold found in California in 1992. The gold was embedded in quartz rock; most of the quartz was removed to reveal a single mass of gold weighing 44 troy pounds (16.4 kgs). The Ironstone nugget is now on display at a heritage museum in Ironstone Vineyards in California.

Adapted from Where to See the World’s Largest Gold Nuggets, 2018, Chris Calam, Sales Manager, Thermo Fisher UK.

Want to find gold? Talk to Portable Analytical Solutions about portable XRF solutions to match your needs.

OUR GOLD INDUSTRY AT A GLANCE

66 operating gold mines across the nation

80,000 people living in gold mining towns or regions

26,000 directly employed in gold mining

Contributed $4.5 billion this financial year

280 tonnes of gold produced in 2016

Australia is the second largest producer after China

Source: Gold Industry Group 2016
Spectral Imaging Transforms Recycling

PAS brings spectral imaging to the growing recycling and waste management industry.

For the recycling industry, legacy ‘RGB’ technologies are unable to pick out the precise spectral characteristics that distinguish similar-looking types of plastic or paper products.

Although hyperspectral imaging sensors have been used for some time within the recycling industry, Headwall’s application-specific approach and a focus on robust, reliable instrumentation means that this technology is continually evolving and keeping page with the rapidly changing recycling landscape across the globe.

Headwall’s hyperspectral sensors collect image data across hundreds of spectral bands with exceptional resolution. The output of this process is a hyperspectral cube comprising all the spatial and spectral data within the field of view. When analyzed, the data leads to efficient, sensible, and profit-generating decisions.

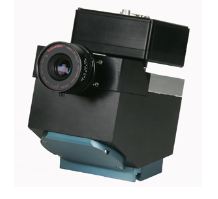
Headwall’s fast-frame-rate Near-Infrared (NIR) Hyperspec® sensors cover the range of 900nm to 1700nm and are perfect for high-speed lines found within the recycling industry.

  • Compact, rugged design for durability and stability
  • Very wide field of view
  • 320 spatial bands and 166 spectral bands
  • Extremely high signal-to-noise

With this technology, the chemical composition of similar-looking materials is clearly distinguishable. Headwall’s Hyperspec III software not only controls sensor operation but integrates seamlessly with downstream robotics to complete the identification and sorting cycle.

Since recycling is a multi-billion-dollar industry, it pays to be precise. And Headwall is able to produce hyperspectral sensor solutions that allow you to achieve real competitive differentiation by extracting more value from your high-speed operation.

Read more about Headwall and NIR Hyperspec® sensors.

Niton XL5 User Video from Acuren

Thermo Fisher Scientific Niton XL5 users are happy users, which makes the team at PAS very happy as well.

Acuren Industrial is a leading provider of non-destructive testing and examination services to industries throughout the US and Canada. 

Watch this video to hear Mark Lang, Acuren’s PMI Manager, explain how the XL5 is meeting the demands of this organisation’s critical work in Texas and beyond.

The Niton XL5 is accurate, portable, robust

The XL5 offers amazing versatility, low limits of detection (LODs) and high sample throughput are critical for Australia and New Zealand’s industrial businesses as they seek to remain competitive in pressured markets. The Thermo Fisher Scientific Niton XL5 handheld XRF analyser provides customers with solutions designed to meet their most demanding applications, maximising performance and productivity.

Contact PAS today, to access the XL5 spec sheet or to arrange a demonstration.

ASD 2018 Goetz Program Winners

ASD Goetz Instrument Program

PAS congratulates all the winners of the ASD 2018 Goetz Instrument Student Support Program and especially Gustavo Togeiro de Alckmin from the University of Tasmania and Ai Hwee “Elise” Kho from the University of Queensland.

They are testament to the quality of innovation and excellence in this country,” said Paul Martin of Portable Analytical Solutions.

As it celebrates its 10th anniversary, the ASD Goetz Instrument Support Program is a highlight of spectral science innovation. The program invites Masters and/or Ph.D. students from around the world to submit a research proposal involving spectral science. Winners are able to borrow an ASD field spectrometer or spectroradiometer at no charge to pursue their research endeavours.

This year, we received a record number of submissions proposing innovative application uses of our ASD instruments in some very interesting and diverse reflectance spectroscopy research applications. The committee struggled to settle on 9 winners from such a high quality field.

FieldSpec® 4 Winners:

Jie Dai
Joint Doctoral Program in Geography
San Diego State University / University of California, US
Title: Mapping and modeling Mikania micrantha invasion in Chitwan community forests

Erola Fenollosa
Ecology, Environmental Sciences and Plant Physiology Doctoral Program
University of Barcelona, Spain
Title: Development of spectroradiometric photoprotective markers for fast plant stress assessment

Becca Goodman
Art Conservation Department
SUNY Buffalo State College, New York, US
Title: Identification of paint pigments with reflectance spectroscopy: The effects of mineral source and particle size

Marcella Piscitelli
Doctorate Program in Agricultural Sciences-Graduate School-Faculty of Agronomy
University of Buenos Aires, Argentina
Title: Estimation of the agricultural soil surface attributes through orbital and field radiometry data

Gustavo Togeiro de Alckmin
School of Land and Food
University of Tasmania, Australia
Title: Determining Biophysical and Biochemical Attributes of Pasture Using Very High Resolution Remote Sensing Techniques


QualitySpec® Trek Winners:

Ai Hwee “Elise” Kho
Centre for Animal Science
University of Queensland, Australia
Title: To test the potential of QualitySpec Trek handheld near infrared spectrometer as a potential on-farm diagnostic tool for parasitic infection in sheep faeces and pasture

Dipika Nadkarni
Department of Archaeology
Durham University, United Kingdom
Title: Identification of plastics in museum collections using fibre optic reflectance spectroscopy


FieldSpec HandHeld 2 Winners:

Meredith McPherson
Department of Ocean Sciences
University of California, US
Title: Applying spectral techniques to determine physiological condition of bull kelp (Nereocystis luetkeana) populations along the northern California coastline

Wendel Raymond
School of Fisheries and Ocean Sciences
University of Alaska, US
Title: Using condition estimates of a marine foundation species to infer temporally integrated seawater nutrient fields

Congratulations to our 2018 winners! We look forward to learning of your research results and everyone greatly appreciates your contribution to spectral science in your fields.  You will find more information on the Goetz Instrument Program here.

Mining & Energy Instrument 2018 Program Winners

Mining & Energy Instrument 2018 Program Winners 2

PAS is pleased to acknowledge this year’s winners of the ASD Students in Mining & Energy Instrument Support Program, announced recently by Malvern Panalytical.

The Students in Mining & Energy Instrument Support Program allows Masters and Ph.D. students from around the world involved in mining and energy disciplines to submit a research proposal involving spectral mineralogy. Winners receive the opportunity to borrow an ASD TerraSpec® spectrometer at no charge in order to pursue their research endeavours.

This year, we had a number of interesting geologic submissions to choose from. Here are the four selected global 2018 Students in Mining & Energy Instrument Support Program winners and their  innovative research topics.


TerraSpec® 4 Winners:

Camilo A. Uribe Mogollon
Earth and Environmental Science Program
New Mexico Institute of Mining and Technology, Mexico, US

Title: White mica geochemistry associated with phyllic alteration halos in porphyry systems: Insights from vectoring tool applied to exploration

Andrew Jacobus
Earth and Environmental Science Program
Binghamton University, York, US 
Title: NIR, pXRF, and XRD Spectroscopy of the Utica Shale in The Mohawk Valley of New York: Towards a Stoichiometric Model to Convert Elemental Abundances to Minerology


TerraSpec Halo Winners:

Taran Bradley
Department of Geology and Geological Engineering
South Dakota School of Mines and Technology, Dakota, US
Title: Detecting the role of pressure and bulk composition on the Al-OH absorption band of white micas: A case study in the Tavşanlı Zone of Turkey

Michael Franke
Applied Geosciences
Martin Luther University of Halle-Wittenberg, Germany
Title: PANGAEA Project

We look forward to your results and greatly appreciate the contributions that you are making to spectral science in your geologic fields! Click here to learn more about the ASD Students in Mining & Energy Instrument Program.

PAS enthusiastically invites students in Australia and New Zealand to consider entering the 2019 competition, with submissions due in late 2018.  Talk to us about your ideas.

PAS to exhibit in RIU Explorers mining conference

Portable Analytical Solutions is excited to be part of the RIU Explorers mining industry conference to be held in Fremantle from 20-22 February 2018.

The popular conference, now in its 17th year, has grown from two to three days in 2018, reflecting the boost in activity throughout the Mining and Exploration Sector.

There are big things happening in the Australian resources sector, with new developments mirroring increased investment from private and government sources committed to greenfield mineral exploration and infrastructure.  (Read more here).

Portable analytical instrumentation and world-class analysers are essential in exploration and development and must-haves in any greenfields project.


Niton XL5

The team from PAS will be demonstrating its impressive Niton XL5 and the Niton range of XRF analysers customised for mining, resources and geological applications.

The new top range model features Mining Mode which enables users to determine the concentration of elements from Mg to U in various types of geochemical materials.

The Niton XL5 delivers cost effective capability for accuracy in oil and gas exploration, mineral discovery and mining operations.

As well as metals, the XL5 measures the elemental composition of scale, sludge, oil, powders and slurries.


Broad range of technologies

Mining and exploration are key industries for PAS with customers across Australia and New Zealand. We provide leading analytical solutions for many applications within the sector that save time and money with in-situ chemical/elemental analysis of samples, providing greater accuracy and faster results. Solutions include field portable analysers utilising x-ray fluorescence (XRF), near infra-red (NIR) spectrometry or FTIR. 

PAS also arranges rental of some analysers, ensuring a perfect fit for customers in their intended application.