Notice: PAS has relocated to Unit 1, 11 Pinnacle Place, Somersby NSW 2250

Portable analytical Solutions logo
Malvern logo

Malvern Panalytical Scientific Award 2023

Our 2023 Scientific Award is now open – and there’s a €5,000 prize for the best entry.
Entries close August 31st – you’ve still got time!

Eureka! Portable XRF and Gold Exploration

Eureka!

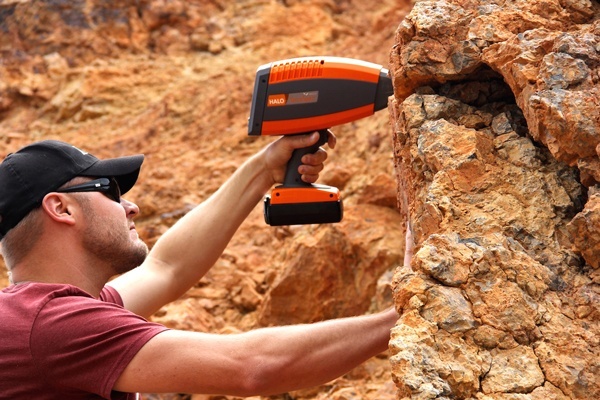
Modern gold exploration takes advantage of technological advancements including Portable X-ray fluorescence (XRF) analysers.

XRF sampling techniques in gold exploration map the distribution of gold and in particular, the various pathfinder elements associated with gold (silver, copper, zinc, nickel, mercury, arsenic and barium). It’s much easier to find the pathfinder elements than it is to find gold: once found, these elements are signposts helping to determine if gold is nearby.

While geophysical methods can be crucial for gold exploration, geochemical methods, including portable XRF solutions from Thermo Fisher, are the only ways to measure concentrations of gold and other associated elements.

In 1848, the discovery of a gold nugget in northern California sparked the California Gold Rush, the largest mass migration in U.S. history. Today, the idea of finding gold holds the same allure, with some modern-day prospectors in the Mother Lode region of California searching for gold the old-fashioned way, using buckets and classifiers, hog pans and cradles.

XRF a boon for modern gold exploration

A major difference between the prospecting of old and today’s multi-billion dollar industry is the scale: tonnes instead of bits and pieces.

Indeed, thanks to modern techniques like portable XRF and good old hard work, traditional gold workings have again produced significant finds, with discovery of large seams and previously unplumbed deposits.

According to a 2017 article published on abc.net.au, “Exploration for gold continues apace in every state and territory and the projects nearly all have one thing in common — the pioneer fossickers and gold panners who pushed wheelbarrows across the country in the first gold rush were there before them.”

The article cites the example of the Commonwealth Project, located in the gold-rich district around Orange, NSW. Advanced exploration techniques have given formerly forgotten workings like Commonwealth a whole new ‘lease’ on life.

“The gold hits at Commonwealth are part of the Lachlan Fold Belt, a 700 kilometre wide belt of gold and silver-bearing ores that run into Victoria,” the article says.

Two of the five largest gold nuggets in the world come from Australia

Many discoveries of large gold nuggets have been recorded, but few of the nuggets remain, having been melted down into gold bars or gold coins. Bullionstar.com profiles the top five largest ‘named’ gold nuggets still in one piece and on display to the public:

  • Pepita Canaã, Brazil: The Pepita Canaã gold nugget was found in the Serra Pelada gold mining region of Brazilian state of Pará in 1983. It has a gross weight of 60.82 kgs and contains 52.33 kgs of gold, or 1682 troy ounces of gold. The nugget was purchased by the Banco Central do Brazil in 1984, and is now on display in the Museu de Valores do Banco Central in Brazil.
  • The Great Triangle, Russia: This gold nugget was found in the Miass area of the Russian Urals mountains in 1842. It has a gross weight of 36.2 kgs and a gold assay of 91%, meaning that it has a fine gold content of 32.94 kgs, or 1059 troy ounces of gold.
  • Hand of Faith, Australia: This 27.66 kgs gold nugget was found in Kingower, Victoria, Australia in 1980. It is the largest gold nugget ever found using a metal detector and contains 875 troy ounces of gold. The Hand of Faith nugget was purchased by the Golden Nugget Casino in Las Vegas, Nevada, and is currently on display in the casino lobby.
  • Normandy Nugget, Australia: This 25.5 kgs (820 ozs) gold nugget was found in 1995 in Kalgoorie, Western Australia. Assay analysis shows the Normandy Nugget to have a gold purity of between 80% and 90%.It was purchased by Normandy Mining, which is now part of Newmont Gold Corporation, and is currently on display at the Perth Mint.
  • Ironstone’s Crown Jewel, California: This nugget is a single piece of crystalline leaf gold found in California in 1992. The gold was embedded in quartz rock; most of the quartz was removed to reveal a single mass of gold weighing 44 troy pounds (16.4 kgs). The Ironstone nugget is now on display at a heritage museum in Ironstone Vineyards in California.

Adapted from Where to See the World’s Largest Gold Nuggets, 2018, Chris Calam, Sales Manager, Thermo Fisher UK.

Want to find gold? Talk to Portable Analytical Solutions about portable XRF solutions to match your needs.

OUR GOLD INDUSTRY AT A GLANCE

66 operating gold mines across the nation

80,000 people living in gold mining towns or regions

26,000 directly employed in gold mining

Contributed $4.5 billion this financial year

280 tonnes of gold produced in 2016

Australia is the second largest producer after China

Source: Gold Industry Group 2016
Spectral Imaging Transforms Recycling

PAS brings spectral imaging to the growing recycling and waste management industry.

For the recycling industry, legacy ‘RGB’ technologies are unable to pick out the precise spectral characteristics that distinguish similar-looking types of plastic or paper products.

Although hyperspectral imaging sensors have been used for some time within the recycling industry, Headwall’s application-specific approach and a focus on robust, reliable instrumentation means that this technology is continually evolving and keeping page with the rapidly changing recycling landscape across the globe.

Headwall’s hyperspectral sensors collect image data across hundreds of spectral bands with exceptional resolution. The output of this process is a hyperspectral cube comprising all the spatial and spectral data within the field of view. When analyzed, the data leads to efficient, sensible, and profit-generating decisions.

Headwall’s fast-frame-rate Near-Infrared (NIR) Hyperspec® sensors cover the range of 900nm to 1700nm and are perfect for high-speed lines found within the recycling industry.

  • Compact, rugged design for durability and stability
  • Very wide field of view
  • 320 spatial bands and 166 spectral bands
  • Extremely high signal-to-noise

With this technology, the chemical composition of similar-looking materials is clearly distinguishable. Headwall’s Hyperspec III software not only controls sensor operation but integrates seamlessly with downstream robotics to complete the identification and sorting cycle.

Since recycling is a multi-billion-dollar industry, it pays to be precise. And Headwall is able to produce hyperspectral sensor solutions that allow you to achieve real competitive differentiation by extracting more value from your high-speed operation.

Read more about Headwall and NIR Hyperspec® sensors.

Niton XL5 User Video from Acuren

Niton XL5 User Video from Acuren

Thermo Fisher Scientific Niton XL5 users are happy users, which makes the team at PAS very happy as well.

Acuren Industrial is a leading provider of non-destructive testing and examination services to industries throughout the US and Canada.

Watch this video to hear Mark Lang, Acuren’s PMI Manager, explain how the XL5 is meeting the demands of this organisation’s critical work in Texas and beyond.

The Niton XL5 is accurate, portable, robust

The XL5 offers amazing versatility, low limits of detection (LODs) and high sample throughput are critical for Australia and New Zealand’s industrial businesses as they seek to remain competitive in pressured markets. The Thermo Fisher Scientific Niton XL5 handheld XRF analyser provides customers with solutions designed to meet their most demanding applications, maximising performance and productivity.

Contact PAS today, to access the XL5 spec sheet or to arrange a demonstration.

PAS to exhibit in RIU Explorers mining conference

Portable Analytical Solutions is excited to be part of the RIU Explorers mining industry conference to be held in Fremantle from 20-22 February 2018.

The popular conference, now in its 17th year, has grown from two to three days in 2018, reflecting the boost in activity throughout the Mining and Exploration Sector.

There are big things happening in the Australian resources sector, with new developments mirroring increased investment from private and government sources committed to greenfield mineral exploration and infrastructure. (Read more here).

Portable analytical instrumentation and world-class analysers are essential in exploration and development and must-haves in any greenfields project.


Niton XL5

The team from PAS will be demonstrating its impressive Niton XL5 and the Niton range of XRF analysers customised for mining, resources and geological applications.

The new top range model features Mining Mode which enables users to determine the concentration of elements from Mg to U in various types of geochemical materials.

The Niton XL5 delivers cost effective capability for accuracy in oil and gas exploration, mineral discovery and mining operations.

As well as metals, the XL5 measures the elemental composition of scale, sludge, oil, powders and slurries.


Broad range of technologies

Mining and exploration are key industries for PAS with customers across Australia and New Zealand. We provide leading analytical solutions for many applications within the sector that save time and money with in-situ chemical/elemental analysis of samples, providing greater accuracy and faster results. Solutions include field portable analysers utilising x-ray fluorescence (XRF), near infra-red (NIR) spectrometry or FTIR.

PAS also arranges rental of some analysers, ensuring a perfect fit for customers in their intended application.

Interest in portable analysers grows in new mining boom

Interest in portable analysers grows in new mining boom 3

Portable analysis solutions for mining applications on the rise

The following article from this month’s Bulk Handling Review may help to explain the noticeable increase in calls to our Service Department in recent times. As well as new enquiries, we’ve received calls from mining industry customers about upgrades, maintenance and training as they put their units to work.

Mining booms back as profits soar

By Oliver Probert

Published in Bulk Handling Review on 8 November 2017

A return to the boom time for Australia’s mining sector has been the driving factor to double profits for the country’s top 50 companies, according to KPMG analysis.

A Fairfax report this week cites KPMG analyst Ted Surette, pointing to statutory profits for the ASX 50 which almost doubled in FY17 to $120 billion, from just $61.3 billion a year ago.

Profits for mining companies rose $27.7 billion, with Rio Tinto and BHP reporting a five-fold increase in profits.

Together the five miners in the ASX 50 – Rio Tinto, BHP, Fortescue, Newcrest Mining and South32 – reported a combined 13% rise in revenue in Fy17, and a 426% increase in profits.

“The earnings of the major miners reflects price stability and improvements in key commodities as well as a significant reduction in impairment charges,” Surette, KPMGs energy and natural resources partner, was quoted as saying.

“The miners’ strong focus on cost containment is reflected in the 70% improvement in year-on-year operating cashflows.”

Rio Tinto opened at $73.55 on the ASX on Wednesday, up 34.7% year-on-year. BHP opened at $28.35, up 21.6%, and recently regained its title as the largest company on the ASX by market capitalisation, overtaking Commonwealth Bank last month.

FMG has seen its share price drop in the last twelve months, down 11.5% this year to a Wednesday opening of $4.96 a share, but this is still up substantially on the $1.54 share price seen in 2015, at the bottom of the recent mining sector recession.

Why does the world end at 2.5 micrometres?

Why does the world end at 2.5 micrometres?

This informative article by Jon Huntington, consultant at Huntington Hyperspectral Pty Ltd and CSIRO Hon. Fellow, was published on LinkedIn.com on October 29, 2017. Portable Analytical Solutions provided an Agilent 4300 FTIR spectrometer loan unit, for the collection of spectra. We are proud to work with colleagues like Jon Huntington, and to be part of insights into this important field of study.


Why does the world end at 2.5 micrometres? Or more precisely, “Why does the SWIR mineral mapping world end at 2.5 micrometres“? It’s like some belief in a flat-earth that we should not venture beyond 2500 nm for fear of falling into a spectral darkness. This is not so because beyond 2500 nm spectroscopic richness and variety continues that can help us better unravel mineral mixtures and gather true full-wavelength mineralogical signatures from 400 to 15,000 nm (0.4 to 15 µm).

Furthermore if we want to equip a next generation National Virtual Core Library (NVCL-2) with ever more accurate descriptions of subsurface mineralogy, and even recognise more mineral content in mineral and basin systems, then we must learn to use the mid-infrared (MIR), along with the VNIR, SWIR and TIR already available.

For close-range core or chip logging, or contact field sample analysis, then there is no good reason for a 2.5 µm limit, other than history. It is primarily a hangover from the remote sensing world where one is limited by the absorption characteristics of the atmosphere. But provide your own sun and get closer then all those problems go away and stopping at 2.5 µm becomes a significant limitation. Sure to go beyond requires good quality detectors but that should no longer be an issue.

So geologists need to be doing their homework and setting the user requirements for hardware, AND algorithms and software, to open up this important wavelength region, the mid-IR (MIR) from 2.5 to 6 µm. In the mid-2000’s Australia pioneered operational, anhydrous mineral mapping in the thermal infrared (the TIR from 6.0-14.5 µm) with the NVCL-1 and should now be getting ready to join-up the SWIR and TIR by articulating why, geologically, we must fill the gap between 2.5 and 6.0 µm. And there are many good reasons.

Chief amongst these reasons is that many minerals have absorption characteristics in this MIR region that will help differentiate them when they occur in mixtures (which is usually) and will help us better model assemblages across the entire VNIR, SWIR, MIR and TIR regions: i.e. help reach the goal of “joint interpretation”. Let’s not also forget that the fundamental stretching vibration of OH-bearing minerals occurs in the MIR, near 2.7 and 2.8 µm. Furthermore it encompasses the region of CH-bond vibrations and all the opportunities that that opens up.

Let’s consider a few examples. We know that mixtures of, say, chlorite and carbonate +/- sericite can be hard to separate in the SWIR, especially when fractions are small. Sometimes the carbonate component can hardly be seen at all (Fig. 1). So we go to the TIR. However TIR carbonates can be severely compromised if the grain size is very fine. But by including the MIR region and the additional absorption features we get confirmation of the obvious carbonate component and any ambiguity is resolved.

Why does the world end at 2.5 micrometres? 5


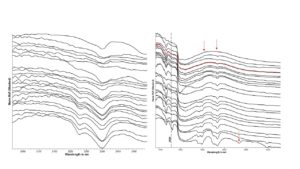
Fig 1 – Left – A series of drill core spectra illustrating chlorite and epidote features at 2254 & 2340 nm. So how many of these spectra also indicate carbonate? Right – The same spectra expanded to cover the long wavelength end of the SWIR (up to the dashed line at 2500 nm) and the MIR and sorted by the depth of the 3974 nm (3.974 µm) carbonate absorption. This is one of several carbonate features (some paired) seen in the MIR near 3500, 3900, 4670, etc. (red arrows). The right-hand plot clearly shows that all samples, except two, contain carbonate, whereas on the left-hand plot it was unclear.


In a similar way separating chlorite, biotite and phlogopite can be even more challenging, but in this case the TIR doesn’t help as much and can often be ambiguous. The MIR, however, shows these three minerals have different characteristics and should make their separation that much easier. The banner image for this note shows a biotite spectrum with two diagnostic features at 2711 and 2822 nm.


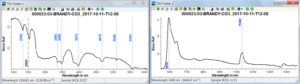
Fig. 2 (below) shows the latter part of the SWIR (2000-2500 nm), the MIR and the TIR for a carbonate vein and illustrates the many valuable MIR carbonate features, as well as quality TIR carbonate features.

Why does the world end at 2.5 micrometres? 6


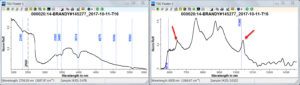
Fig. 3 on the other hand (below) shows a spectrum from the same core interval but with subdued SWIR absorption, highly distorted TIR carbonate features (red arrows) caused by very fine grain size, but still quite usable carbonate features in the MIR.

Why does the world end at 2.5 micrometres? 7


So the MIR adds extra wavelengths, increased clarity in unravelling mineral mixtures and difficult situations, and the chance to model smaller fractions.


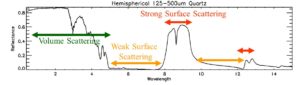
Fig. 4 below (courtesy of Andy Green) reminds us of the different absorption / scattering processes that apply as a function of sensing wavelength and it is gratifying that the MIR is largely a region of volume scattering and thus like what we are used to in the SWIR, and unlike the surface scattering we experience in the TIR. Note that for this example we should certainly be continuing our sensing to 5 µm.

Why does the world end at 2.5 micrometres? 8

What is required to move all this MIR opportunity forward? The instrument engineers are already looking at plugging this mid-IR region and the CSIRO/NVCL community have been talking about it internally for a couple of years, and indeed built a prototype. But we really need to accelerate our preparations, especially in building the geological arguments for investment in this area, in building the spectral reference libraries and, crucially, adapting our TSG algorithms and software to meet the challenge. All this cannot be left until after the technology is out there. It must go on in parallel and it will take vision, homework, collaboration and commitment. Let’s do it!

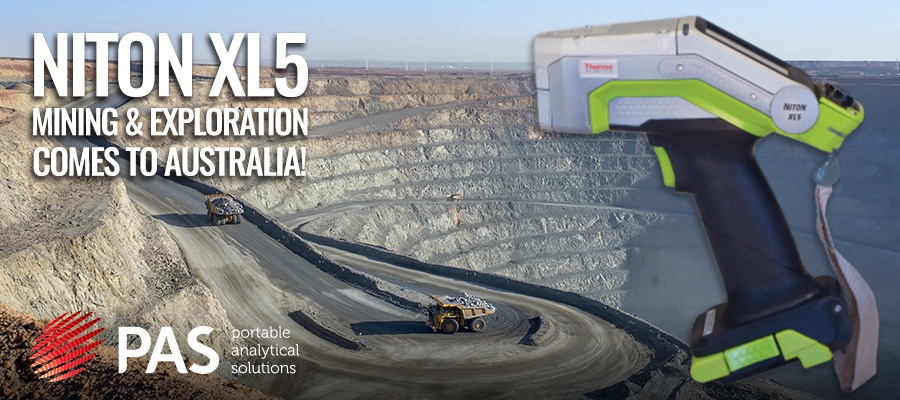
Niton XL5 Mining & Exploration Comes To Australia

Niton XL5 Mining & Exploration Comes To Australia 10

Exciting News! PAS has access to the first Niton XL5 Mining & Exploration unit in Australia.

UTILISE MINING MODE TO GATHER ACCURATE, REAL TIME GEOCHEMICAL DATA AND MAXIMISE OVERALL PRODUCTIVITY.

Mining mode enables users to determine the concentration of elements from Mg to U in various types of geochemical materials. Reduce overheads by implementing the Niton XL5 for cost effective mining exploration, mineral discovery, mining operations and oil and gas exploration. Take full advantage of all the XL5 has to offer:
  • Qualitative and quantitative analysis for process and quality control
  • Rapid inspection and analysis to ensure product chemistry specifications are met
  • Portable options that are lightweight and easy to use, delivering non-destructive analysis and lab-quality results in the field.
The latest XRF product release from Thermo, has a number of improvements that are designed to meet the challenging product specification set by our customers, these include:
  • Dramatically Reduce Size and Weight
  • Improved Light Element Performance
  • Simple User Interface
  • Inbuilt GPS (standard)
  • Micro and Macro cameras
  • Hot Swap Batteries
  • 50kv 5Watt Xray Tube
  • and many more

For more information or a Demo please feel free to contact us directly.

PAS showcased the Niton XL5 Mining & Exploration Unit at the 2017 International Mining & Resources Conference. Check out the details below for more information, or contact us today.

Scrap Metal is Serious (Environmentally Responsible) Business

Scrap Metal is Serious (Environmentally Responsible) Business 12

Scrap Metal is Serious (Environmental Responsible) Business

When people today think of recycling, they may not automatically think, ‘Scrap Metal’. Yet this was the earliest form of recycling and continues to be a major contributor to environmental sustainability.

Thanks to the Scrap Metal Recycling Association of New Zealand (SMRANZ), here are some key facts you may not know:

  • Aluminium can be recycled indefinitely, as reprocessing does not damage its structure. Aluminium is also the most cost-effective material to recycle
  • Recycling 1kg of aluminium saves up to 6kg of bauxite, 4kg of chemical products, and 14 kWh of electricity – enough to power a TV for three hours
  • Two-thirds of all cans on supermarket shelves are made from steel. They have a very thin layer of tin that protects the surface of the can, which is why steel cans are often called “tins”
  • Every tonne of steel that is recycled saves 1.5 tonnes of iron ore and reduces air emissions by 86%
  • Steel scrap is essential in the process of making new steel and can be recycled indefinitely without losing its quality. Most new steel products use at least 25% recycled steel in their production

Information like this demonstrates the enormous value of fast, accurate analysis and identification of metals to expedite the scrap recycling process and to enhance export and trade opportunities.

In its November 2016 report, IBISWorld identified 250 Key Success Factors for a Scrap Metal Recycling business, with these being the most important:

  • Establishing key export markets
  • Access to a multi-skilled and flexible workforce
  • Access to efficient production and recycling techniques

That’s where portable analysis capabilities really shine.

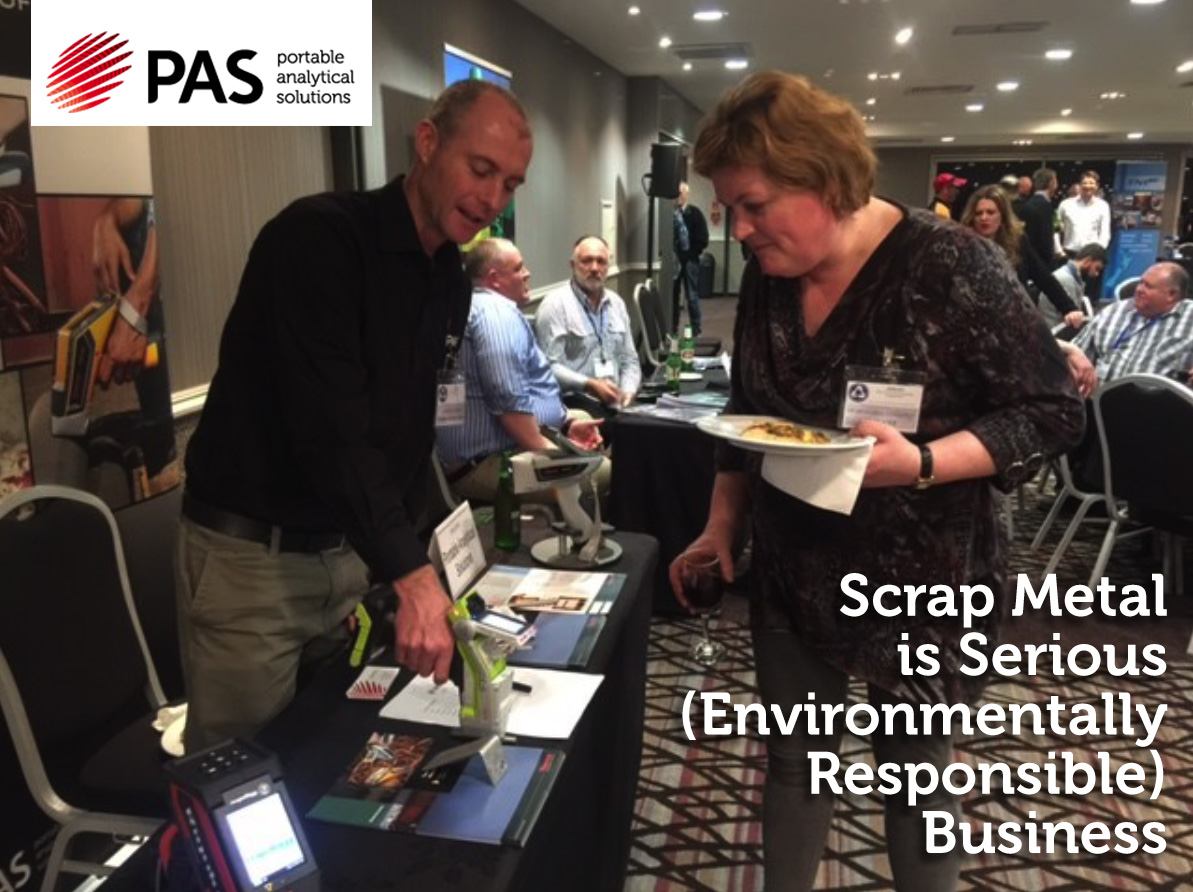
Picture above: Jason Parker, our Sales Manager in New Zealand, had a great time at the recent SMRANZ Convention 2017, demonstrating the Niton XL5.

Monitoring Bleaching of the Great Barrier Reef with Hyperspectral Cameras and UAVs

Monitoring Bleaching of the Great Barrier Reef with Hyperspectral Cameras and UAVs 14

A recent article in UAS Vision, an online UK-based publication specialising in UAV news, has highlighted the revolutionary use of UAVs with Hyperspectral Cameras as demonstrated by two of our many innovative clients in Australia.

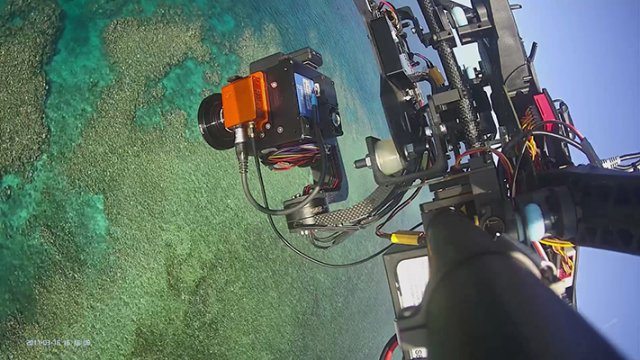
QUT’s remote sensing and unmanned aerial vehicle (UAV) experts are partnering with the Australian Institute for Marine Science (AIMS) to test whether small drones, machine learning and specialised hyperspectral cameras can monitor the Great Barrier Reef more quickly, efficiently and in more detail than manned aircraft and satellite surveys. QUT’s project leader Associate Professor Felipe Gonzalez said the team surveyed three reefs in the Great Barrier Reef Marine Park from 60 metres in the air while AIMS divers recorded precise levels of coral bleaching from under the water.

“By taking readings from the air and verifying them against the AIMS data from below the surface, we are teaching the system how to see and classify bleaching levels,” said Professor Gonzalez an aeronautical engineer from QUT’s Institute for Future Environments and Australian Centre for Robotic Vision. “Flying 60 metres above the water gives us a spatial resolution of 9.2 centimetres per pixel, which we’ve found to be more than enough detail to detect and monitor individual corals and their level of bleaching.

“This is great news for us because low-altitude drones can cover far more area in a day than in-water surveys and they’re not hampered by cloud cover as manned aircraft and satellites are – a system like this has the real potential to boost the frequency of monitoring activities in an economical way. The more data scientists have at their fingertips during a bleaching event, the better they can address it. We see small drones with hyperspectral cameras acting as a rapid response tool for threatened reefs during and after coral bleaching events.”

Roughly the size of Japan, the Great Barrier Reef is home to around 3,000 reefs stretching 2,300 kilometres, making it slow and costly to survey using traditional methods. Miniaturised hyperspectral cameras are key to the new aerial system. Not long ago, these cameras were so large and expensive only satellites and manned aircraft could carry them.

Standard cameras record images in three bands of the visible spectrum – red, green and blue – mixing those bands together to create colours as humans see them. Professor Gonzalez said the hyperspectral camera, by comparison, captures 270 bands in the visible and near-infrared portions of the spectrum, providing far more detail than the human eye can see and at an ultra-high resolution.

“You can’t just watch hyperspectral footage in the same way we can watch a video from a standard camera – we must process all the data to extract meaning from it,” Professor Gonzalez said. “We’re building an artificial intelligence system that processes the data by identifying and categorising the different ‘hyperspectral fingerprints’ for objects within the footage.

“Every object gives off a unique hyperspectral signature, like a fingerprint. The signature for sand is different to the signature for coral and, likewise, brain coral is different to soft coral. More importantly, an individual coral colony will give off different hyperspectral signatures as its bleaching level changes, so we can potentially track those changes in individual corals over time.

“The more fingerprints in our database, the more accurate and effective the system.”

Professor Gonzalez was one of three QUT researchers speaking at the World of Drones Congress in Brisbane, joining Professors Des Butler and Tristan Perez on the two-day program. QUT’s drone and remote-sensing innovations were on show at the congress’ accompanying expo, highlighting research advances in marine robots (COTSbot), agricultural robots (Ag Bot II), and in using UAVs to detect and monitor both pests and gas leaks.

QUT was the principal academic sponsor of the World of Drones Congress, which ran 31 August to 2 September.


Ⓒ UAS Vision 04/09/2017. Reprinted by permission.

Hyperspec Nano

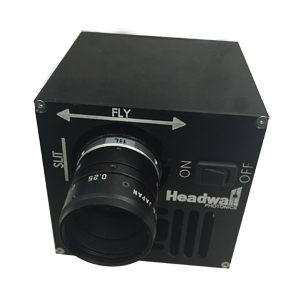
Headwall’s new Nano-Hyperspec® is a completely integrated hyperspectral sensor designed for the VNIR (400-1000nm) spectral range.

A completely integrated lightweight (<0.52kg) VNIR hyperspectral sensor for small UAV applications that includes on-board data-processing/storage and GPS/IMU. Today’s UAVs are exceptionally small and light and they demand payloads to match.

A key advantage of Nano-Hyperspec is that it also includes 480GB of on-board data collection/storage, plus attached GPS/IMU functionality. This allows the payload bay of the UAV to be optimized for other needs such as video or thermal imaging. Weight and space is saved, making for a more efficient airborne solution.

Nano-Hyperspec is perfect for today’s new breed of hand-launched UAVs and drones, representing a mix of fixed-wing and multi-rotor models to meet practically any deployment scenario.

How to Apply the HyperSpec Nano

Agriculture / Viticulture / Vegetation

Speak to PAS for expert guidance on hyperspectral imaging options from Headwall Photonics.