Malvern Panalytical Scientific Award 2023

Our 2023 Scientific Award is now open – and there’s a €5,000 prize for the best entry.
Entries close August 31st – you’ve still got time!

Precision Agriculture: Giving Farmers More Control Over The Field

Precision Agriculture Gives Farmers More Control Over The Field

Instant data collection and dissemination means farmers can predict with accuracy the health and yield of their soils and crops. This is where precision agriculture comes in.

What Is Precision Agriculture?

Advances in technology have enabled agricultural businesses of all sizes to implement precision agriculture. It’s history began through early GPS-satellite adoption, which allowed farmers to gather data and steer agriculture equipment automatically.

This technology has further advanced over time, allowing farmers to gather even more precise data — sensors, aerial devices, stationary IoT solutions for precision agriculture, etc. Now farmers can accurately:

  • Harvest historical data, predictive modeling, and environmental insights to select crops with higher yields
  • Capture real-time data on site performance
  • Achieve sustainable economic and environmental practices on the farm
  • Provide the right amount of water, nutrition, and pest control based on digital farming data
  • Predict and react to changes in the weather

This is ideal across these disciplines:

CropsGrainsSoilViticulture
With proper analysis, producers are able to accurately measure crop growth, monitor on-farm trials and identify uneven spreading or inconsistent sprays. On the basis of reliable results, farm management and planning decisions are much easier.As the grain production industry increasingly uses precision ag monitoring solutions, farmers can use NIR and hyperspectral solutions to answer key questions about crop rotation patterns, yield management, storage and irrigation.Sustainable farming starts with the soil as the base, using analysis to develop a long-term program. Reliable, reproducible analysis of soil texture, soil moisture, salt levels and paddock rotation is achievable through hyperspectral analysis.Satellite and airborne platforms provide images depicting vineyard conditions, maximising grape yield and quality while managing location-specific risks and variations. Achieves the best results and optimises harvests in this lucrative industry.

Advantages Of Precision Farming In Agriculture 

Technology is seen as a way by agriculture business owners to improve the quality of decision-making, the ROI, as well as the overall security of their facilities.

More Monitoring Data

Growers can continuously monitor a wide range of metrics thanks to digital tools. They will keep track of rainfall levels, the sources and types of nutrients their crops need, soil samples, fertiliser inputs, etc.

Improved Efficiency

In the long run, farmers gain valuable real-time access to valuable real-time data when they adopt precision agriculture sensors to monitor soil moisture, crop health, and nutrition levels. By recognising patterns and forecasting changes, potential risks, and yields, a site manager can maximise efficiency and profitability, during both harvest and planting season.

Increased Crop Protection

Overuse of chemicals is one of the reasons for high crop and soil pressures. In an effort to prevent crop damage from insects, farmers often overuse nitrogen. The use of chemicals reduces the sustainability of the site – and it’s costly. Precision ag helps farmers optimise pest control and use chemicals only when needed and protect crops more efficiently.

Irrigation management

With precision ag, a farming team can accurately tell when to irrigate a field using centralised command-and-control tools.

Incorporating Spectroscopy Into Precision Agriculture

The use of spectroscopy allows for precise crop/food analysis and quality control. 

And using spectroscopies in small portable devices, such as portable drones and handheld devices, has only further increased the application of these techniques. 

Crop and food analysis by conventional methods is time-consuming, complex, destructive, and requires infrastructure and resources. Simple or no sample preparation is often required for spectroscopy measurements, and it’s easy for farmers to use and interpret the data.

How Spectroscopy Works

Spectroscopy is widely used as an analytical tool in many different fields due to its precise and non-destructive nature.

In spectroscopy, the wavelength of light and other materials are used to measure the absorption, transmission, and emission of electromagnetic radiation. Spectroscopy also includes the calculation of collision energies between electrons, protons, and ions within a compound and those of other compounds.

Foods and crops are analysed and quality controlled using spectroscopy in agriculture. Chemical composition, microbial infections, toxins, pests, pathogens, and adulteration are some of the uses. Defects also can be monitored both internally and externally.

Optical Spectroscopy in Agriculture

Agricultural use of optical/light spectroscopy is common. 

Each element or compound has its own spectral signature based on its composition and will respond to different wavelengths. For this reason, spectroscopy is used in biological sciences to determine the composition of materials as well as to conduct quantitative analyses.

Spectra of light are made of varying wavelengths, frequencies, and energies.

Agriculture draws heavily on spectroscopy’s use of the infrared (IR) and ultraviolet-visible spectral ranges.

Ultraviolet-visible (UV-VIS)

The ultraviolet-visible spectrum used for spectroscopy lies within the UV (100 nm to 380 nm) and visible (380 nm to 750 nm) range of wavelengths.

UV-VIS spectroscopy is primarily used to control the quality of edible oils. Two aspects of oil that can be tested are: fat oxidation and the overall colour.

  • Fat oxidation: 

A measure of fat oxidation is the anisidine value (AV). When exposed to light, oxygen, and high temperatures, fat is oxidised. The amount of aldehyde produced is measured by AV. An oil’s AV should not be greater than 8 to prevent oxidation, which reduces its quality.

  • Oil colour: 

In cold-pressed oils, plant pigments such as chlorophyll or carotenoids can colour the oil. Due to the removal of pigments during refining, refined oils have very little pigment. Food producers strive to increase the amount of carotenoids in food oils, since they are healthy antioxidants. On the other hand, chlorophyll promotes oxidation and gives oil a bitter note, so keeping chlorophyll concentrations low is necessary to keep consumers happy.

Fluorescence Spectroscopy

It is a phenomenon in which a fluorescent molecule or fluorophore emits light after absorbing UV light and visible light.

Quantitative analyses are frequently carried out using fluorescence spectroscopy, which is sensitive and specific enough to detect low levels of compounds. This makes fluorescence spectroscopy ideal for handling contaminants and for structural analysis. Several techniques can be used with fluorescence, including liquid chromatography and fluorometry.

  • Control of toxins

Salmonella, mycotoxins, and other pathogenic microbes or fungi can produce toxins as contaminants in food. A toxin may also be present in food when it is an antibiotic (penicillin) or an additive (aspartame). 

  • Structural analysis

Proteins, carbohydrates, and lipids in oils can be detected by fluorescence. Oils can be checked for adulteration with cheaper substitutes with this property. In oil that has been repeatedly fried, fluorescence can determine vitamin E, anisidine, and iodine levels.

Near-Infrared Spectroscopy

Near-infrared is the most widely-used technique in spectroscopic applications for agriculture and is applied for quantitative analysis.

A Spectrometer For Every Occasion
The ASD FieldSpec 4 leaves the factory floor calibrated as a spectroradiometer, ready for precise radiance and irradiance measurements, but is equally suited for use as a spectrometer for accurate contact or stand-off reflectance analysis with a wide range of standard accessories.
All ASD FieldSpec spectrometers and spectroradiometers provide 3 nm spectral resolution in the VNIR (350 nm – 1000 nm) range. Four spectral resolution options are available for the SWIR (1001 nm – 2500 nm) range.

  • The enhanced 6 nm SWIR spectral resolution of the ASD FieldSpec 4 Hi-Res NG spectroradiometer provides both the sampling interval (bandwidth) and the spectral resolution to support accurate calibration and image classification analysis with the next generation high spectral resolution hyperspectral sensors.
  • With 8 nm SWIR spectral resolution the ASD FieldSpec 4 Hi-Res spectroradiometer is the instrument of choice for geological studies and atmospheric research.
  • The ASD FieldSpec 4 Standard-Res spectroradiometer, with 10 nm SWIR resolution is perfectly suited for characterizing spectral features with a resolution of 10 nm to 50 nm, which covers the technical requirements of most field researchers. The ASD FieldSpec 4 Standard-Res spectroradiometer has long been the industry’s go-to workhorse instrument for trusted field spectroscopy and the scope of potential applications is broad.
  • Because of its wide optical slit the ASD FieldSpec 4 Wide–Res spectroradiometer provides the highest signal throughput and offers the best signal to noise performance of any ASD FieldSpec model. These high throughput characteristics also benefit field measurements taken in less than optimal illumination conditions.
  • The 30 nm SWIR resolution of the ASD FieldSpec 4 Wide-Res spectroradiometer makes it an ideal fit for applications such as vegetation analysis and vegetation indices that are characterized by broad spectral features. This instrument is also available at a significantly lower price point than other ASD FieldSpec models, which makes it an attractive option when budgets are tight.

The Gold Standard In Field Spectroradiometers
ASD FieldSpec® line of full-range spectroradiometers deliver the fastest and most accurate spectral field measurements available with excellent performance, signal and integration speeds.
The FieldSpec range has been designed around the specific needs of researchers when collecting spectral measurements in the field. Long-range wireless increases collection coverage potential from a stationary base. Superior signal throughput, signal-to-noise, and radiometric performance regardless of atmospheric conditions.
All ASD FieldSpec spectrometers and spectroradiometers provide 3 nm spectral resolution in the VNIR (350 nm – 1000 nm) range. Four spectral resolution options are available for the SWIR (1001 nm – 2500 nm) range – Hi-Res NG, Hi-Res, Std-Res, Wide-Res. Full range (350 – 2500 nm)

  • Comprehensive options for UV/Vis/NIR/SWIR field requirements
  • Faster integration speed facilitates more measurements in a limited solar collection time window
  • Permanent fibre-optic cable design reduces the risk of signal loss
  • Pro-pack backpack easily allows field portability with the FieldSpec 4 product line
Precision Agriculture: Giving Farmers More Control Over The Field 1

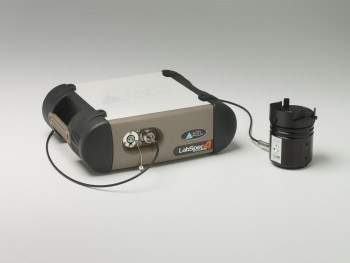
LabSpec NIR SpectrometersAnalytical Spectral Devices (ASD) – NIR
Portable, laboratory-grade instrumentation for fast-moving environments, LabSpec performs rapid, non-destructive qualitative and quantitative materials analysis using state-of-the-art NIR technology.
With options in Standard-Res, High-Res and Benchtop analysers, these spectrometers are optimised for rapid analysis, providing instant results with no sample preparation.

  • Evaluate hundreds of samples per day
  • Real-time identification of liquid and solid spectral characteristics
  • Measure multiple properties simultaneously
  • Compatible with ASD sampling accessories.

Speak to PAS for expert advice on the precision agriculture solution best suited to your application.

There are many categories of NIR spectroscopy use in agriculture:

  • Pest, Disease, and Toxin Detection

NIR is used to detect fungal contamination and estimate levels of mycotoxins.

  • Drought management

Due to its unique spectrum, water levels are monitored to determine if crops are suffering from water stress and adjust irrigation accordingly.

  • Maturity

Dry matter content is used to determine when they are mature enough for harvest. Green mature fruits should be estimated based on dry matter to avoid harvesting them too early and preventing proper ripening. By harvesting them later, transportation and storage time would be reduced.

  • Fertiliser application

Leaf spectrometry can be used to track plant growth. Scientists and farmers can monitor crop progress and respond by applying the correct nutrients to the crops.

  • Processing

Process centres must determine parameters such as dry matter, BRIX, and water content. It is also possible to use NIR to detect them, choose the best fresh produce, and monitor the production process.

  • Post-harvest quality control

The storage, transportation, and retail sale of climacteric fruits can take months after harvest. In order to eliminate spoiled produce and prevent the rest of the product from being affected by ethylene, various quality parameters, such as ripeness, internal damage, and external appearance, can be monitored.

PAS’s Full Range Of Precision Agriculture Solutions

  • Highest-quality range of imaging products
  • Featuring custom-designed data collection software
  • Lab-based, ground or airborne solutions

For solutions in hyperspectral imaging for precision ag, speak to PAS about its hardware and software offerings from ASD Inc. and Headwall Photonics. Contact us today.
Michelangelo, Or Michelangel-NO? The Best Way To Identify Fake Art And Artifacts

Michelangelo, Or Michelangel-NO? The Best Way To Identify Fake Art And Artifacts

Art has now grown into a billion-dollar market, with collectors investing in established and emerging artists for huge profits. 

There are risks involved with investing in art, even if it doesn’t seem as volatile as investing in stocks: Artwork authentication is becoming increasingly complicated, and there is an alarming number of false paintings floating around. 

Remember: About 40% of works sold each year are forgeries, according to estimates.

A number of sophisticated techniques are used today to examine and verify art and historical artifacts.

Utilisation of X-ray fluorescence or infrared spectroscopy is beneficial for dating archaeological artifacts, analysing pigment and identifying them, and improving the viability of future research.

PAS provides reproducible results in the fields of art history, archaeology, anthropology and for commercial authentication of assets.

Spectroscopy And the Science of Art Authentication

Attempting to identify an artist’s work today involves scientists working behind the scenes at a museum or gallery. 

Recent advances in analytical techniques enable the composition of the pigments and binders of the body of a painting to be determined in great detail. 

These methods of in-situ analysis of paints, pigments, and resins offer straightforward, non-destructive analysis using X-ray fluorescence (XRF), infrared spectroscopy (IR), and Raman spectroscopy.

Inspecting a questioned artwork under a microscope can reveal information about the materials used and the chemical makeup of the pigments, which either substantiates the item’s authenticity or reveals materials contrary to its authenticity.

Studying Colour And Identifying Art Fakes with Spectroscopy

When the pigments in a painting match those in an earlier certified artwork, it is easy to determine whether the painting is authentic. 

Since the paints used for the older pieces are different from those used for the replicas, a recent copy of an ancient work will read differently. 

It is also possible to discover whether a painting is the work of the same artist by comparing and contrasting the spectral curves of pigment in different pictures.

Case Studies In Art Spectroscopy 

Materials containing light elements are not able to absorb X-rays that are projected at them, but materials containing heavier elements do.

X-rays can determine whether a canvas contains the same number of threads in horizontal and vertical directions. This is how many famous paintings by artists such as Vincent van Gogh have been authenticated and some have proven to be fakes.

A Long Island storage container belonged to Alex Matter’s parents – both artists and friends of artist Jackson Pollock. In that container, he found 32 paintings that were attributed to the famous painter. 

Although attributed to Pollock, these paintings weren’t signed. Therefore, it wasn’t clear if the paintings were real.

A variety of layers of the paintings were stripped of paint chips, including the bottom layers, to determine if they had been restored or otherwise altered.

Their analysis of the paint chips involved Fourier-Transform Infrared Microspectroscopy or FTIR. A compound’s properties can be determined using spectroscopy by studying its interaction with a known wavelength of radiation. The radiation used in this technique is infrared light. 

They compared the infrared spectra of chemical compounds present in the paint chips to reference spectra of known materials on the Matter paintings. 

Paint chips from the Matter paintings matched the Ferrari Red colour found in Red 254. Pollock died in the early 1980s, long after Ferrari Red was patented.

For Martin, discovering that Ferrari Red was an epiphany: Those pieces of art could not have been created by Jackson Pollock.

Full Range Of Products

PAS determines the best tool for your artwork or historical artifact analysis using the most appropriate technology, with sales guidance, detailed product information and training.

  • A choice of technologies from one expert supplier
  • Fully compliant technology for accurate reproducible results
  • Non-destructive testing options
  • Handheld analysers for ease of access

Agilent Technologies: 4300 Handheld FTIR (Fourier Transform Infra-Red)

Michelangelo, Or Michelangel-NO? The Best Way To Identify Fake Art And Artifacts 2

The first of its kind, the Agilent 4300 Handheld FTIR analyser combines lightweight ergonomics, ease of use, ruggedness and flexibility in one system.

Ideal for field use and situations away from a laboratory, the unit comes with easy-to-use custom software to enable users at all experience levels to measure without damaging or removing the sample.

  • Weighs in at approximately 2kg
  • Non-destructive measurement
  • Immediate, at-site results
  • An ultra-short internal optical path yields better results
  • Interchangeable interfaces handle all types of materials

A Spectrometer For Every Occasion

As with visible photography, infrared photography detects reflected light, which allows short wave cameras to be valuable tools for IR reflectography. 

Although they are not visible, these can find details beneath the painting’s surface that can’t be seen by the naked eye. 

Infrared light penetrates the painting’s upper layers since pigments are transparent at wavelengths greater than 1100 nm. By reflecting from the base, the IR light is then absorbed by the underdrawing.

Art historians and conservators can better understand the intention of the artist by getting a visual sense of what lies beneath the first layer of pigment. Additionally, it can be used to identify details pertaining to the work’s historical context or to verify the artwork’s authenticity.

Thermo Fisher Scientific: Niton™XL5

Michelangelo, Or Michelangel-NO? The Best Way To Identify Fake Art And Artifacts 3

The optional integrated camera allows users to locate, view, and store the analysis image and the test results for later reference.

The handheld Niton XL5 for light element (Mg-S) analysis offers the lowest limits of detection and fastest measurement times.

  • Integrated GPS on some models
  • Rapid accurate decisions on-site
  • Low limits of detection
  • Optimisation for light elements in some models

X-Ray Fluorescence (XRF) Spectroscopy is an x-ray based method for identifying the chemical elements of paint and non-organic materials.

The Niton XL5 is an advanced Portable XRF analyser (PXRF) with sophisticated models designed for specific industry applications. A tilting, colour, touch-screen display allows easy viewing of sample results under any condition.

PAS provides leading art verification and analysis solutions and support. For more information specifically on our full range and how they can help your business, please give us a call today.

Science Goes Bush: An Overview Of Hyperspectral Remote Sensing

Science Goes Bush: An Overview Of Hyperspectral Remote Sensing

Unmanned aerial vehicles (UAVs) have rapidly become a viable alternative to satellites and manned aircraft for conducting hyperspectral remote sensing.

Likewise, hyperspectral (HS) sensing instruments have evolved along with UAVs; both are getting smaller, lighter, and easier to use. 

How Hyperspectral Imaging Works

HS sensors are attached to UAVs in order to capture slices of incoming scenes (by way of a physical slit) and they present each slice as discrete wavelength components on a focal plane array (FPA). 

Dispersing the image slices into discrete wavelengths is achieved with a diffraction grating. 

In addition to HS sensors, ancillary instruments such as light detection and ranging (LiDAR) and GPS can also be used to ensure complete and accurate imagery collection. 

A planimetrically correct image is obtained by removing the effects of perspective (tilt) and relief (terrain) with the use of these instruments.

These portable commercial, off-the-shelf (COTS) aerial drone solutions can map terrain features of potential conflict areas and classify major material classes very easily.


The visible spectrum of electromagnetic radiation is what the human eye is capable of seeing and identifying. This ranges from about 380 nanometers to around 700 nanometers.

Ultraviolet sits below this spectrum, while infrared lies above this “visible” portion of the spectrum. Bees can see UV, while snakes see infrared. This is where HS sensors can help us.

They collect, in the case of hyperspectral, a full spectrum of image data for every pixel within the field of view. 

Why Is Hyperspectral Imaging Important?

In precision agriculture, there are a variety of vegetative indices (VIs) that are dependent on seeing into infrared ranges, where fluorescence spectral signatures of chlorophyll are detectable. 

It is possible to see and quantify chlorophyll fluorescence to reveal information about crop stress and vigor that cannot be seen by the naked eye. 

A wide variety of vegetative indices use hyperspectral data to answer the question: Do my crops have diseases I cannot see? Do my soils have sufficient nutrients? Am I at risk for invasive species?

The Right Hyperspectral Tool For The Job

Headwall’s Nano-Hyperspec® is a completely integrated hyperspectral sensor designed for the VNIR (400-1000nm) spectral range.

A completely integrated lightweight (<0.52kg) VNIR hyperspectral sensor for small UAV applications that includes on-board data-processing/storage and GPS/IMU. Today’s UAVs are exceptionally small and light and they demand payloads to match.

A key advantage of Nano-Hyperspec is that it also includes 480GB of on-board data collection/storage, plus attached GPS/IMU functionality. This allows the payload bay of the UAV to be optimised for other needs such as video or thermal imaging. Weight and space is saved, making for a more efficient airborne solution.

Nano-Hyperspec is perfect for today’s new breed of hand-launched UAVs and drones, representing a mix of fixed-wing and multi-rotor models to meet practically any deployment scenario.

Nano-Hyperspec Specifications

  • VNIR spectral range (400-1000nm)
  • 270 spectral bands, 640 spatial bands
  • Maximum frame rate: 350Hz
  • 480 GB internal storage
  • Direct-attached GPS / IMU capabilities
  • Light, small, robust

People assume they just need to buy a sensor and a UAV and put them together. 

However, battery life matters, balance issues occur, and the relationship between ground speed and frame rate can make things difficult. 

PAS can recommend the right kind of UAV, take its size/weight/power into consideration, integrate spectral sensors with other instruments such as LiDAR, and provide complete solutions. Contact us for more information today.

Out In The Field: Hyperspectral Remote Sensing

Hyperspectral remote sensing has many applications for the agriculture industry.

From crop disease detection to infrastructure inspection; environmental monitoring to pollution analysis; high spectral resolution for field remote sensing analysis helps with:

Water Quality

Using a combination of field and satellite remote sensing methods, oceanographers, limnologists and other environmental and marine researchers can perform thorough assessments of vast waterways, glaciers and wetlands.

Headwall’s Nano-Hyperspec® is about the size and weight of a Rubik’s Cube, so it represents the smallest true hyperspectral airborne sensor on the market. It holds a solid-state drive that eliminates the need to have a supplemental data computer that would consume weight and space. The GPS-IMU manages all the positioning functions as well as any roll-pitch-yaw anomalies that otherwise would impact data quality. Headwall offers a range of GPS-IMU instruments, with the most precise of them shown here.


Headwall does considerable work to assure the quality of hyperspectral data coming from its sensors. This can include stabilising gimbals (the Ronin gimbal shown here) as well as powerful orthorectification done during post-processing. Headwall manages this with its own powerful suite of applications software.

The thermal camera is small and light, which means the whole instrument payload can be easily managed by the DJI Matrice 600 Pro, which is one of the most popular enterprise-level UAVs on the market today.

Agricultural Remote Sensing

For responsible analysis and management of some of the Earth’s most precious resources, PAS has the instrument to suit your needs

Forestry / Plant Remote Sensing

Forests and ecological resources are important assets that need to be properly managed. Accurate analysis of forest health, population, growth areas and damage is possible through sophisticated remote-sensing technologies available from PAS.

The Importance Of Good Software

The development of hyperspectral software to help with management along the way and during post-processing is just as important as reducing the size and weight of the hyperspectral sensor. 

Science Goes Bush: An Overview Of Hyperspectral Remote Sensing 4

Nano-Hyperspec can be controlled using Headwall’s airborne Hyperspec III software while in the air. 

During post-processing, the software also can draw in GPS data to enable orthorectification. It has a polygon tool to determine the “start-stop” coordinates for the sensors. 

By using LiDAR instruments to estimate the height of objects and artifacts beneath the UAV flight path, the hyperspectral data can be represented accurately.

In order to manage UAV flights, sensor operations, and so on, a software platform with a simple interface but the ability to manage gigabytes worth of hyperspectral data is helpful. 

The basic Headwall hyperspectral software performs these important tasks, but Headwall has enhanced the software to handle GPS data and orthorectification during post-processing.

Nano-Hyperspec is available in two options:

  • OEM-programmable sensor configuration
  • High-performance sensor configuration for end-users


PAS can guide you to the solution you require, providing sales and product support, training and upgrades as you implement leading Headwall hyperspectral technology. Speak to PAS for expert guidance on hyperspectral imaging options from Headwall Photonics.

Alloy there! Why Accurate Metal Sorting Is Critical For Scrap Metal Recyclers

Alloy there! Why Accurate Metal Sorting Is Critical For Scrap Metal Recyclers

The scrap metal industry in Australia has a market value of $2.4 billion. And alloys are the big prize.

With a recycling rate of 90% in 2018-19 according to the 2020 National Waste Report, it outperforms any other material category.

Scrap and steel industries invested millions of dollars nationwide into building infrastructure so that scrap metal can be collected, sorted, shredded, and processed throughout Australia.

A snapshot Of The Scrap Metal Industry In Australia

Metal scrap generated 5.6 million tonnes, or 223 kg per capita, in 2018-19.

Australian scrap metal is melted as feedstock for the country’s $29 billion steel industry, which produces 5.5 million tonnes of steel a year and employs 110,000 Australians (2017-18) and generates $29 billion in revenue annually.

A total of 24.2% of BlueScope’s Port Kembla Steelworks’ products are made from recycled or recovered steel.

Rose Read, CEO of the National Waste and Recycling Industry Council (NWRIC), says using ferrous scrap as a substitute for virgin ore has huge carbon emission reduction benefits.

“On average almost two tonnes of carbon dioxide are emitted for every tonne of steel produced from virgin ore, accounting for approximately 7% of global greenhouse gas emissions. By comparison, a tonne of steel produced from scrap produces just 25% of the emissions of scrap made from virgin ore,” Read told the ABC.

Exporters are enjoying record prices on the global scrap metal market as a result of the boom. Shredded scrap metal prices last year traded below the 10-year average of $330 ($425) per tonne. It dropped as low as $US270 ($348) in 2017. Today a tonne of scrap metal can fetch a staggering $US430 ($554) per tonne.

Steel scrap exports from Australia and New Zealand have risen sharply. In 2019, Oceania countries exported 250,016 tonnes of scrap to India, up 24.5% over the previous year.

Metal wastes constitute the bulk of Australia’s waste exports, including cast iron wastes, ferrous metals, gold, copper, and aluminum scrap (82% of the total value). 

Scrap metals were the sole or main export to Bangladesh (100%), Taiwan (99%) and China (85%). Pakistan also received mostly metals (80%) and some textiles (12%). Exports to Thailand and Indonesia were split between metals and paper and cardboard (75% to 25% for Thailand and 23% to 74% for Indonesia). Vietnam received metals (59%) and agricultural organics (35%). Exports to India were a mix of scrap metals (55%), paper and cardboard (32%) and tyres (11%). Malaysia received a mix of paper and cardboard (36%), metals (28%) and plastics (20%). The Republic of Korea received metals (51%), agricultural organics (28%) and hazardous waste (14%).

Meanwhile, scrap metal is the 17th largest export earner for New Zealand. Around 500,000 tonnes of ferrous and 50,000 tonnes of non-ferrous scrap metal are generated each year. Of that 45% of ferrous scrap metal and 90% of non-ferrous metal is exported.

Metals that are not recycled can end up being dumped, left on-site as an environmental pollutant, or they can end up in a landfill. These are all unwise, considering the industry’s efforts to do as much as it can for the environment, and how landfill capacity is decreasing.

It takes longer for scrap metal to decompose in landfills than other waste. Scrap metal left in landfills degrades, poisoning the soil and causing pollution, among other issues.

Recovered scrap metal is a major activity for industry firms. Metal recovery refers to the process of fabricating new, usable products or materials from scrap. Metals frequently recycled are steel, copper, aluminum, zinc, lead, nickel, and titanium.

Take the guesswork out of your scrap metal operation

Scrap can be contaminated or contain hazardous elements if its chemical composition is unclear, indicating a risk for quality, safety, and regulatory compliance.

Handheld X-ray fluorescence (XRF) analysers provide accurate, reliable analysis of scrap metal materials during scrap metal operations.

Niton XRF analysers can verify elements of interest in virtually all types of metal alloys, from trace levels to commercially pure metals, and are capable of distinguishing alloy grades that are nearly identical in composition to one another.

  • Positively identify alloys at material transfer points and guarantee product quality
  • Determine metal composition for accurate sorting
  • Identify tramp/trace elements
  • Get nondestructive analysis in seconds, with little or no need for sample preparation
  • Increase the speed of metal processing operations
“Sorting is very important because we need to guarantee that the material we are shipping to consumers is what we say it is …. If it isn’t, the mill or foundry we’re shipping to could reject the load or downgrade it, and that would hurt our reputation — and our bottom line.” – Recycling Magazine, owner of a Massachusetts-based salvage yard.

The Importance Of Alloy Metal Verification For Industry

The verification of metal alloys for quality assurance and quality control (QA/QC) has never been more important for product reliability and safety – particularly in the automotive, aerospace and steel manufacturing industries. 

From metal production through final product assembly, the potential for material mix-ups is real. And material mix-ups can lead to product failures. 

With all types of metal manufacturing and fabrication operations facing increasingly stringent safety regulations, today’s best practices include testing 100% of critical materials.

XRF analysers are important tools for performing material identification and alloy confirmation.

Alloy there! Why Accurate Metal Sorting Is Critical For Scrap Metal Recyclers 5

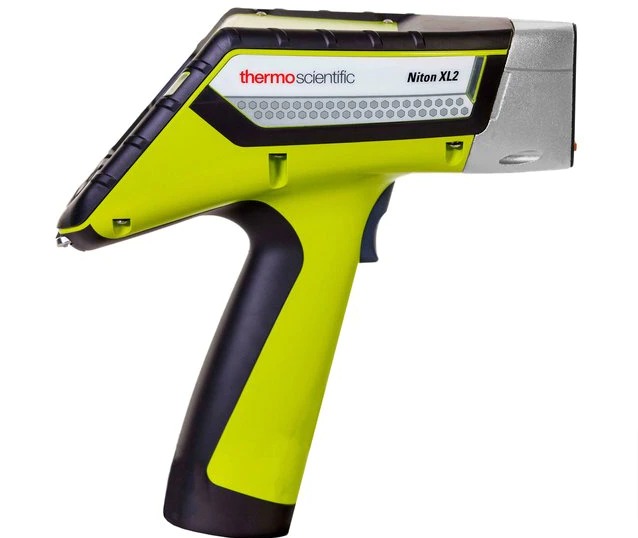
The Niton XL2 Plus

Features & Benefits

  • 2W X-Ray Tube
  • Silicon Drift Detector (SDD) for light element detection
  • Detector ProGuard Protection
  • Micro Camera
  • Hot Swap Battery
  • Touch Screen and Directional Keys
  • Password Protected Security
  • IP54 Certified (Splash/ Dust Proof)
  • Nose Cone Alignment Guides

Specific Scrap Alloy Metal Applications

  • Verification of metals and alloys in manufacturing
  • Quality Assurance testing for positive material identification
  • Point-and-shoot sorting at scrap recycling operations
  • Coating thickness measurements from single element layers

How The Niton XL2 Plus Works

How is ferrous scrap metal processed?

Almost all metal-based goods can be recycled, such as old cars, white goods and consumer goods. Shredders are typically used to process light gauge materials, then sent to separation plants (this is where the Niton XL2 Plus comes in) to detect for ferrous metals and non-ferrous metals. Heavier grades of material are reduced with large industrial shears and by manual oxy cutting. After being melted in electric arc or blast furnaces, the ferrous scrap metal is cooled, shaped and made into products.

Automotive shredder residue (ASR) or floc, which is frequently disposed of as waste during the shredding process, is a common source of waste. Some facilities can convert ASR into its core elements of hydrogen for use in transportation fuel and carbon dioxide. This material would save approximately one million tonnes from landfills.

The advantages of scrap metal recycling

Energy Savings

Recycling scrap metal at sites also has an impressive energy efficiency benefit. Steel can be recycled at 75% lower energy costs than using raw materials to produce the metal, and aluminum can be recycled at 95% lower energy costs. Thus, less electricity is wasted, less carbon dioxide is produced, and overall the carbon footprint is reduced. 

Financial Gains 

Recycling metal waste is not only environmentally friendly, but also financially profitable as well. Copper is one of the most desired and valuable metals. Furthermore, brass attracts a high return because of its weight and durability. Steel is still worth recycling, even though it has a lower monetary value. And aluminum still remains one of the most recyclable materials on Earth – over 80% of it can be recycled.

  • Metal is 100% recyclable; it is permanent and can be recycled over and over again
  • Recycling 1 tonne of steel can save 1.5 tonnes of iron ore from being mined and saves natural habitats and forests
  • Recycling metal avoids sending a permanent material to landfill

Speak to PAS today for expert guidance on how the Thermo Fisher Niton XL2 Plus best suits your industry application and particular conditions.

Related Links

The Sorting Process Made Easy

Australian Council Of Recycling

National Waste Recycling Industry Association (NWRIC)

Australian Metal Recycling Industry Association Victoria

Waste Contractors & Recyclers Association of NSW (WCRA)

NSW Police Force: Scrap Metal Industry 

Scrap Metal Industry Public Register

NSW Legislation: Scrap Metal Industry Act

ABLIS: Registration of a Scrap Metal Dealer – New South Wales

EPA: Waste Avoidance and Resource Recovery Strategy

NSW Fair Trading: Scrap metal exemption certificate

NSW Parliament: Scrap Metal Industry Bill 2016

For Food Quality And Safety, This Hyperspectral Tool Is A Cut Above

For Food Quality And Safety, This Hyperspectral Tool Is A Cut Above

Automated, accurate, and flexible hyperspectral machine vision has revolutionised food manufacturing and inspection processes, such as in the meat and fruit industries.

MV.X – Headwall’s award-winning hyperspectral technology – solves and highlights food quality and safety issues using its powerful, embedded computing power and a high-performance VNIR spectrometer to provide real-time, actionable results. 

Introducing The Hyperspec® MV.X

Hyperspectral imaging is no longer limited to the lab, as Headwall’s MV.X combines high-speed processing power with industry-leading hyperspectral imagery for live classification. 

Clients, such as food-processing plants, use this to detect potentially harmful foreign materials for removal. 

You can even use the MV.X offline to create AI detection and grading algorithms which can then be uploaded and stored on units installed on the line and which act on incoming hyperspectral data in real time. 

Designed for use in harsh industrial environments and capable of functioning both inside and outside, the MV.X offers simplicity of installation and direct output of actionable results. 


How To Apply The Hyperspec® MV.X

Foreign object detection Safety and Pathogen detection Sorting and grading Process analytics Contamination detection


Fruits and vegetables such as apples and tomatoes aren’t all the same. They differ in shape, ripeness, optical qualities, weight, and bruising. 

It is more efficient to market the harvest when these qualities can be precisely measured. 

It is also important that produce is sorted accurately to prevent inaccurate pricing.

Detect And Measure With The Hyperspec® MV.X

Using hyperspectral imaging to detect foreign matter and pathogens that are invisible to the naked eye can improve the safety of food. 

This form of imaging provides far better material classification than RGB colour cameras on poultry, seafood, lamb, beef, and specialty crops.

A high level of biogenic amines indicates the decomposition of seafood. 

A rise in histamine levels is typically associated with such decomposition. This is also called “scombroid fish poisoning”.

By measuring the concentration of histamines in fish, hyperspectral imaging provides a method for determining the freshness of fish in an instant, contact-free manner.


Sort And Detect With The Hyperspec® MV.X 


To meet government regulations, the global food inspection industry needs newer and more precise tools for everything from specialty crops to seafood and poultry.

In order to overcome the uncertainties resulting from human inspections or limited capacity RGB cameras, more advanced high-resolution imaging systems are being adopted that are also reliable, affordable, and easy to deploy.

Using techniques such as hyperspectral imaging, food producers can sort and detect contamination at the right time, improving product quality and consistency and avoiding costly recalls.

A key differentiator for hyperspectral imaging sensors is their ability to classify food based on a number of geometrical and spectral parameters. 

Rather than simply interpreting “pass” or “fail” measurements, nuts and specialty crops can be inspected in ways that maximise quality and productivity.

Benefits Of The Hyperspec® MV.X

• Visualise value at the speed of light

• Classify and detect using the spectral dimension

• Hyperspectral classification is intuitive, reliable, and fast


Key Features Of The Hyperspec® MV.X

Specifically designed for advanced machine vision and process analytics applications, the dust-proof and watertight MX.V system is compact, dust-proof, and watertight. 

The perClass® MIRA software features machine learning and artificial intelligence to process data runtime and simplify model development. 

The MV.X web user interface also allows for remote system control and maintenance.

Suitable for both indoor and outdoor installations, this rugged solution can be installed in any production environment. It includes:

  • Hyperspectral Imaging System – not just a camera
  • Built for challenging VNIR (400-1000nm) machine-vision apps on the processing line
  • Fast onboard, embedded processing for real-time classification
  • GenICam-compliant GigE interface with an IP67-rated housing
  • Flexible yet robust and straightforward workflow

Technical Specifications

The Hyperspec® MV.X has:

  • A spectral range of 400-1000nm
  • 270 spectral bands
  • 640 spatial pixels
  • Max frame rate: as high as 485Hz
  • FWHM slit image: 6nm

What is Spectral Imaging?

In spectral imaging, every location in an image plane is sampled for spectral information.

There are several techniques available, based on a variety of factors, including spectral resolution, number of bands, the width, and the presence of adjacent bands.

The process of hyperspectral imaging, like other types of spectral imaging, involves collecting and analysing information that spans the electromagnetic spectrum.

Using hyperspectral imaging, you gain information about each pixel in an image of a scene, in order to locate objects, identify materials, or detect processes.

PAS provides leading Spectral Imaging solutions and support. For more information on Headwall’s Hyperspec® MV.X and how it can help your business, give us a call today.

Related links:

Product data sheet (PDF)

Oregano & Parsley: Quality Inspection of Herbs & Spices (PDF)

The Future Of Food (PDF)

Food Authority (NSW)

Food Standards Australia & New Zealand

Food Quality & Safety

Department of Agriculture, Water and the Environment

Department of Health: Food Standards And Safety

The Food Safety Information Council

Gold Testing is Big Business And Niton is The Gold Standard

Gold Testing Is Big Business And Niton Is The Gold Standard

With the high price and volatility of gold today, more efficient gold-testing methods are being used to establish the value of items like jewellery or coins being purchased, sold, or recycled.

Testing gold and precious metals demands accurate and reliable results to eliminate variability and subjectivity, and ensure fair transactions. 

That’s why businesses turn to our portable X-ray fluorescence (PXRF) analysers for fast, accurate, and non-destructive analysis of precious metals entering their shops. 

In as little as 3-10 seconds, our XRF analysers provide exact karat weight and percentages of all elements within an item they test, enabling them to detect non-standard and counterfeit gold with the accuracy of a fire assay.

The electronic testing approach also appeals to people who don’t want to deal with acids in the testing process. 

The most advanced portable electronic gold tester is an XRF. 

These battery-operated testers contain an X-ray tube and shoot a small X-ray beam at the piece being tested. 

The beam interacts with the elements in the piece and the machine reads the results. 

The PAS range of analysers for gold buyers

PAS’ XRF analysers supply concentrations for 21 elements and karat values in seconds.

Our Thermo Fisher Scientific Niton DXL and Niton XL2 precious metal and gold purity analysers are equipped with proprietary, patented AuDIT gold-plating detection technology. 

Several independent, complementary methods in the AuDIT (Au/gold Detection & Identification Technology) software work in tandem to alert you to the probability that an item is plated, regardless of the gold concentration of the plated surface layer. 

AuDIT technology works for vermeil (gold-plated silver), as well as gold-plated copper, steel, tungsten and any other non-gold substrate.

  • Precious metals and gold testing machines simultaneously measure the content of all gold and precious metals without manually changing your calibration based on the metal you’re analysing
  • Precisely determine the presence and concentration of more than 22 precious metal and trace alloying elements, including but not limited to gold (Au), Silver (Ag), Platinum (Pt), Palladium (Pd), Nickel (Ni), Tungsten (W), and Lead (Pb).
  • Eliminate the toxicity associated with nitric acid test methods
  • Capture images and focus in on small areas using our integrated camera and small spot feature (depends on model).

Niton™ XL2 Precious Metal AnalyserThermo Fisher Scientific – XRFNiton™ DXL AnalyserThermo Fisher Scientific – Bench Top XRF
* Standard analytical range: >25 elements from S to U (varies by application).
* Point and shoot simplicity—very easy to use even by nontechnical personnel
* Ideally suited for retail environments
* Non-destructive analysis with near-instantaneous results
* Ergonomic design
* Innovative colour touch-screen display and touch-screen keyboard
* Improved intuitive interface
* CCD Camera
* Large sample chamber with a back window for customer view
* Optional small spot for the isolation of small components
Learn moreLearn more

The benefits of Niton Portable XRF Analysers

These tools offer instantaneous, accurate and non-destructive precious metals analysis.

When quick and informed decisions need to be made to ensure the profitability of a transaction in precious metals trading, or to make sure jewellery is free of toxic substances, the use of X-ray fluorescence spectroscopy can be invaluable.

Thermo Scientific Niton portable XRF desktop and handheld analysers provide pawn shops, cash-for-gold businesses, jewellers, recyclers and refineries with fast, reliable and accurate results for:

  • Determination of karat grade and fineness
  • Analysis of all precious metals including gold
  • Analysis of alloying elements like copper, zinc, nickel, etc.
  • Analysis of toxic elements like cadmium or lead etc.
  • Detection of gold plating presence with the patented AuDIT Technology

Unlike traditional test methods, all precious metals and alloys, in various sizes and shapes are tested completely non-destructively.

8 reasons not to use acid to test jewellery

Gold is traditionally tested by applying a small drop of strong acid to its surface, such as nitric acid. Metals tend to bubble and fizz while precious metals don’t. Despite the fact that results are generally considered reliable, there are several reasons to avoid acid and instead use a handheld analyser.

  1. Counting karats with acid isn’t very accurate. It rounds to the nearest acid testing solution.
  2. You must scratch the gold on a stone, so you are actually rubbing some of the gold off the jewellery.
  3. Gold plating cannot be determined unless the gold is deeply scratched.
  4. Using these solutions is dangerous and unhealthy. Since testing solutions contain corrosives, they must be handled and stored with extreme care.
  5. Iron and steel items will pass the stone test for platinum, so you must additionally use a powerful magnet to identify these metals.
  6. When testing for silver, the solution will dull the polishing of the piece, and leave a mark where the acid was placed.
  7. Acid will not tell you what other alloying elements make up the composition of the jewellery.
  8. Counterfeiters have managed to develop a stainless steel alloy that will acid test as 18kt white gold, but contains no precious metal at all. Many people have been duped by chains made from this material.

We do not recommend using portable XRF analysis on gold bars, and bullions. If it is used, we strongly suggest that a secondary analysis is done just to ensure the absence of thick plating or any adulteration.

How XRF in gold testing works

X-ray fluorescence spectroscopy begins by exposing the sample in question to X-rays rays. 

The high-energy photons tend to knock electrons from their orbits around the nuclei of atoms in the sample as they strike it. When this occurs, the electron in the outer orbit of the atom will fall into the shell of the missing electron. 

Outer shell electrons possess more energy than inner shell electrons, so the relocated electron has an excess of energy that is released as an X-ray fluorescence photon. The sample’s composition produces this particular fluorescence. 

This spectrum is collected by the detector and converted into electrical impulses proportional to the energies of the X-rays in the spectrum of the sample. 

By counting the pulses in the emitted spectrum, we can identify the presence and concentration of the component(s) of interest within the sample. 

Each element has its own distinct X-ray signature, so we can determine which part of the spectrum is associated with that component.

Contact PAS for expert guidance about the Thermo Fisher Scientific Niton DXL or the Niton XL2, and which will best suit your gold-buying needs.

Scrap Metal Recycling – The Sorting Process Made Easy

Scrap Metal Recycling – The Sorting Process Made Easy

There’s never been a more critical time to ensure accuracy and transparency when it comes to metal sorting in your scrap metal recycling process.

And, with ever-increasing competition and supplier demands, industry leaders know maintaining profitability in a volatile metal-pricing environment is crucial.

Regardless of your application, there is an industry-leading handheld XRF or LIBs analyser available to do the job, ensuring the alloy grade and composition meet your specifications.

In both cases, these methods of metal testing are more effective, accurate and efficient than a variety of other more labour intensive, time-consuming and destructive methods.

To learn more about what XRF is and how it works, read the XRF Technology ebook from Thermo Scientific.

Scrap Metal Recycling Is Big Business

Australia generates 40% of its waste from construction and demolition. Scrap metal is included in this amount.

Recycling metal is important because it reduces the amount of:

· Waste sent to landfill

· Mining needed for new metals

· Air and water pollution

· Energy needed to create new products (versus from virgin materials)

Stainless steel, copper, bronze, brass, aluminum and iron can be recycled. The metals in your old appliances, cars, planes and building materials can be recycled to make new ones. The metal in many food and drink cans is usually already 100% recycled.

Facts about Metal, Aluminium & Steel

350,000 aluminium cans are produced every minute1 tonne of recycled steel saves 1,131kg of iron ore, 633kg of coal and 54kg of limestone95% energy saved creating cans from recycled aluminium

Source: SUEZ

The price of scrap copper per kilo is worth the most money. This is due to the amount that’s used in our society and the cost of mining and processing copper into products such as pipes and wire. Here’s a rough guide to various scrap metal prices. Please note, this is a guide only, and prices can fluctuate quite wildly.

The Easy Way To Identify And Sort Scrap Metal

Globalised trade in scrap metal, alloy stock and finished products has resulted in increased costs of alloy mix-ups for suppliers, distributors and industrial consumers. 

So, in order to ensure quality, safety and regulatory compliance, the exact chemical composition of scrap, including the existence of contaminants or hazardous elements, must be determined.

Scrap metal recyclers use handheld PXRF to:

  • Rapidly sort mixed metals
  • Positively identify numerous alloys, including light alloys
  • Guarantee the quality of their product to their customers

What is metal waste?

We use metals in many everyday products and applications. Vehicles, trucks, trains, train tracks, ships, aeroplanes, white goods, cutlery, pots and pans all contain metal.

Metals can be classified as “ferrous” and “non-ferrous”. Common ferrous metals include carbon steel, alloy steel, wrought iron, and cast iron. Non-ferrous metals include aluminum, copper, lead, zinc, and tin.

The Process of Metal Recycling

The process of metal recycling involves these stages:

  • The metal is collected by scrapyards and sorted into bins. Non-ferrous metals that contain steel or iron are considered scrap steel.
  • Stainless steel and other valuable nickel alloys are sorted into their specific alloy grade to increase value.
  • Metal recycling centres sell their scrap to super collectors, which shred it and then melt it in furnaces at high temperatures to produce blocks, ingots, or sheets to make metal products.

In spite of the energy costs involved in recycling scrap metal, the energy needed is less than that needed to make it out of raw materials.

Recycling cans, for instance, can save 75% more energy than producing steel from raw materials. 

With around 90% of steel products being recycled in Australia, every tonne of recycled steel is equivalent to 1130 kilograms of iron ore, more than 630 kilograms of coal and over 54 kilograms of limestone being saved from being mined.

How PAS Products Slash Your Sorting Time

Niton XRF analysers are the ideal tool for screening incoming scrap, as well as providing quick, non-destructive chemistry and grade verification of chill castings and final product.

The Katana KT-100 LIBs analyser offers superior light element identification in metal and alloy applications to ensure profitability and product quality, without the radiation aspect of XRF. 

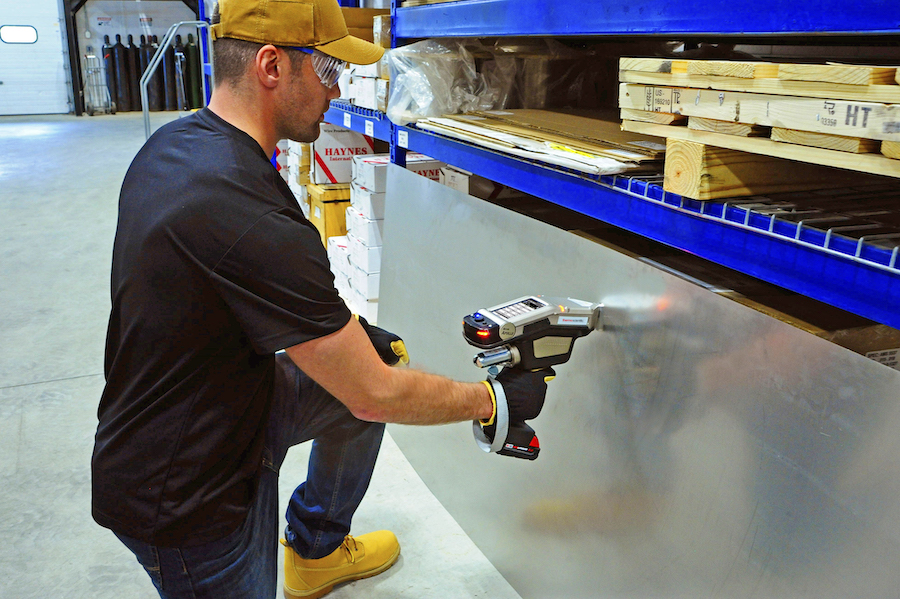
The Niton Apollo analyser offers carbon analysis in the field for specific material sorting

Elements such as magnesium (Mg) and aluminium (Al) can now be accurately identified in 1-2 seconds.

PAS is an accredited supplier of both the Niton XRF and the Katana LIBs ranges for positive material identification (PMI) and non-destructive testing (NDT). 

We provide expertise at every stage of the purchasing process, with training, compliance, factory guaranteed service and product support.

Although some alloys are detectable via either instrument, clear differences and expert advice will determine which instrument is best for you. Contact us today for advice.

Explore our full range.

Sorting scrap metal in the recycling industry has advanced. To boost your workplace efficiency and accuracy, contact PAS for the best product to suit your needs.

Scrap Metal Recycling And Waste Links

Australian Council Of Recycling

National Waste Recycling Industry Association (NWRIC)

Australian Metal Recycling Industry Association Victoria

Waste Contractors & Recyclers Association of NSW (WCRA)

NSW Police Force: Scrap Metal Industry 

Scrap Metal Industry Public Register

NSW Legislation: Scrap Metal Industry Act

ABLIS: Registration of a Scrap Metal Dealer – New South Wales

EPA: Waste Avoidance and Resource Recovery Strategy

NSW Fair Trading: Scrap metal exemption certificate

NSW Parliament: Scrap Metal Industry Bill 2016

Asbestos Resources And Information Guide

Asbestos Resources And Information Guide

Finding asbestos at a site creates not only a potentially dangerous situation for workers, but it leads to stoppages that cost businesses money while the area is tested and cleared.

We have compiled a very useful list of resources on asbestos, which we refer to in our detection and sampling process, including links to all the important Australian government bodies that monitor and regulate asbestos issues in the community. 

We are – as are many in the industry – working diligently to stay ahead of any potential risks associated with asbestos. 

Asbestos Information And Links 

Since 2013, the Asbestos Safety and Eradication Agency has been overseeing national initiatives to raise awareness of asbestos-containing materials, and to provide management, removal and disposal of asbestos in an effective and safe manner. It provides advice and assistance, but does not enforce the law.


The Asbestos Disease Research Institute (ADRI) came to be in 2009 to address emerging public health concerns surrounding asbestos-related diseases. ADRI studies asbestos-related diseases in terms of pre-clinical (basic), clinical, and epidemiological methods, leading to improved methods of prevention, diagnostic, therapeutic procedures, and treatment strategies. As part of its national work on prevention and public health, the organisation provides support for patients, advocates for public policy, and raises awareness about preventing future exposure to asbestos.


In 1945, all states and the Federal Government attended a conference on testing services coordination that led to NATA being formed two years later. As Australia’s foremost laboratory accreditation body, it provides a national testing service that covers all technical, industrial, and geographical areas of the country. So NATA enjoys a leading position on the international stage as an authority in ensuring technical standards in Australia.


The Australian Asbestos Network was developed through a project funded by the National Health and Medical Research Council that began in 2006. It aims to develop an online resource for people in the community who would like to learn more about asbestos; its history, current impacts on Australia and how they can all help minimise its harmful effects on our health and well-being.


The NSW Government is required under the Home Building Act 1989 to maintain a register of residential properties that contain loose-fill asbestos insulation. The register is known as the Loose-fill Asbestos Insulation Register (LFAI Register). The LFAI is in place in order to “provide safety, increased certainty and support to the community”, according to a statement from NSW Fair Trading.


The NSW Environment Protection Authority (EPA) is the primary environmental regulator for New South Wales. It partners with business, government and the community to reduce pollution and waste, protect human health, and prevent degradation of the environment. It encourages businesses to make sure their activities do not harm the environment and human health by: issuing environment protection licences; monitoring compliance; ordering the clean-up of pollution and imposing fines or prosecuting organisations and individuals who break the law. It also responds to and manages pollution incidents involving hazardous materials such as asbestos (in collaboration with other government agencies).


You can find asbestos disposal facilities using this search tool provided by The Asbestos Safety and Eradication Agency. Always call or contact your disposal facility prior to transporting any asbestos waste. Many facilities will only accept and handle asbestos waste at certain times, in order to maximise landfill efficiency and minimise health risks. Most facilities also have procedures (for example, asbestos waste wrapping requirements) that people disposing will need to follow carefully, to ensure asbestos waste is accepted by the facility.


The NSW Asbestos Coordination Committee (NACC) works to improve the management, monitoring and response to asbestos issues in NSW through collaboration and programs. A number of NSW state agencies and other organisations collaborate through the NACC.


The SWA was established in 2008 by the Australian government to develop national policies on occupational safety and health. Workers’ compensation and WHS policies are developed through this agency. It is responsible for developing and evaluating national policies and strategies; developing and evaluating model WHS legislative frameworks; conducting research; and collecting, analysing and reporting data. The national policy body has no regulating authority over workplace safety laws. WHS laws are regulated and enforced by the Commonwealth and the states and territories. If you manage or control a workplace, you are responsible for ensuring an asbestos register is prepared, maintained, and accessible.


As well as developing and delivering policies and programs, the Department advises the Australian Government on health issues. Assuring better health for all Australians is one of its goals. It provides valuable information to all Australians regarding asbestos health risks. It is the 100th anniversary of the Department of Health this year. It was created in 1921 after a pandemic, and now it is dealing with a COVID-19 pandemic in 2021.


The WHS Act aims to protect the health and safety of workers and workplaces by eliminating or minimising hazards and risks, in order to provide maximum protection against hazards and risks. Compliance and enforcement guidelines support the WHS legislation.


For help with non-destructive asbestos screening, detection and identification, Portable Analytical Solutions has an effective, real-time and reliable solution. Contact us today.

Portable XRFs – the big guns in mining and exploration

Portable XRFs – The Big Guns In Mining And Exploration

Any mining company or contractor should conduct a due diligence phase prior to a property acquisition or before digging into a site.

Similarly, logging drill core to determine its geochemistry at the feasibility study stage makes sense to avoid any surprises further into the project.

But these phases take up valuable time, resources and money.

Thankfully, the mining and exploration industries continue to develop, and we now have specialised hand-held X-Ray Fluorescence (XRF) devices to make determining the geochemistry of rock and soil samples easier and faster.

There are a few Portable XRFs (PXRFs) on the market, but some are better than others.

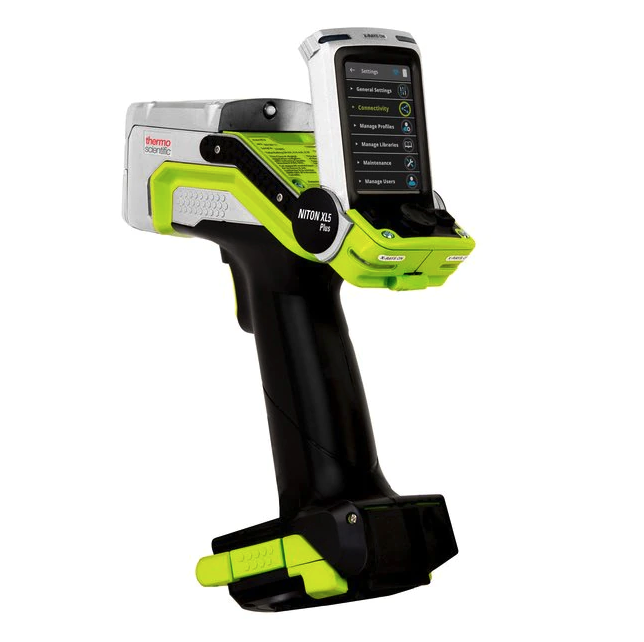
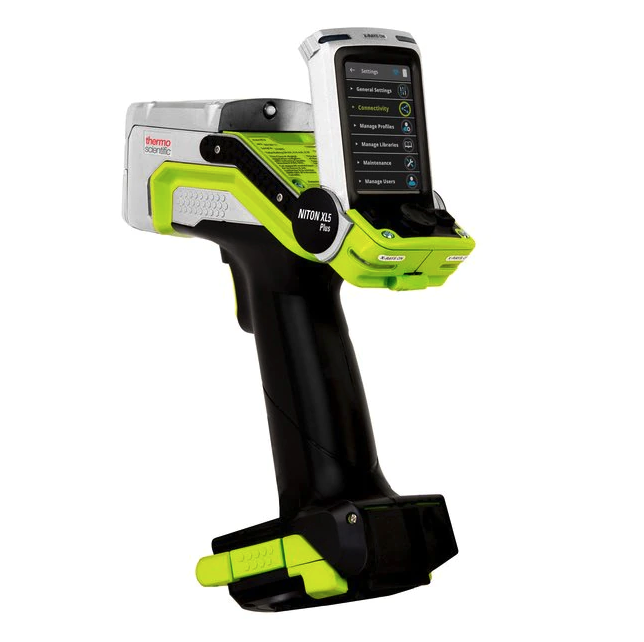
Meet The Niton XL5 Plus

As a geochemistry tool, there’s something special about the Thermo Fisher Niton XL5 Plus

Aside from its striking colour and sleek design, it’s one of the best handheld elemental XRF analysers out there to support your field-based decision making or to offer enhancement to any multi-element geochemical data plotting.

Combined with the right sample handling and protocols, it can save time, lower your costs and add value to your mineral exploration and mining settings when it is used in a fit-for-purpose application.

Portable XRFs - the big guns in mining and exploration 6

Benefits of portable XRF analyser

  • Quantify up to 41 elements simultaneously
  • Most analysis is performed within seconds – this increases your productivity
  • You have the performance of a lab-grade EDXRF spectrometer in the palm of your hand
  • It’s Intuitive, easy-to-operate interface
    WiFi, Bluetooth and GPS – built-in
  • Hot-swappable battery, can be charged by UPS trickle-charge or 12V DC
  • Has an internal system check standard
  • Accessories built for the industry
  • Backed by local support, knowledge, service
  • Large, installed customer database

Features of portable XRF analyser

  • Easy to use
  • Lightweight
  • Cost-effective
  • Nondestructive
  • Accurate results
  • Instant results
  • Can be used on-site

Chemical/ Elemental analysis is achieved through Thermo Fisher Scientific’s range of Niton hand-held XRF analysers.
Mining drlling

Why You Need This For Mining And Exploration

There are many mining companies – across nickel, iron ore, uranium, gold and base metal mines – already using portable XRF analysers in their day-to-day processes as a screening tool.

They do this because they know it saves them valuable time and money.

Broad Mining Applications Of A Portable XRF

  • Mineral exploration
  • Environmental and mine closure
  • Mineral processing and geometallurgy
  • Mining and grade control

Let’s break this down, and dig deeper into some more specific uses.

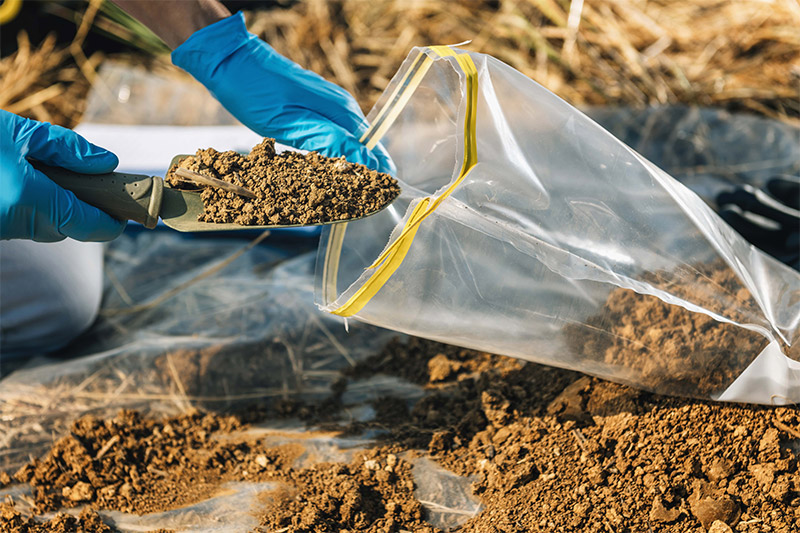
Soil Sampling

This is usually one of the first stages of any exploration project.

Grids are often set up where samples are collected on a grid spacing, so with the PXRF you can easily take samples, sieve it, analyse it and move on to the next sample, getting through these large grids much faster than with traditional methods.

You can store the data in the analyser or send it to the field camp or lab for further analysis.

Real-time analysis with handheld XRF analysers is also a good way to prequalify samples for off-site lab analysis to ensure only the best samples are evaluated, saving you money.

XRF analysers can be used for in-quarry exploration and evaluating the composition of raw materials such as phosphate, sulphides, potash, gypsum and limestone for industrial use.

Soil testing

Real-Time Field Mapping

When you’re at ground level with your geopick, rock sampling, you can use the PXRF to test those rock-chip samples immediately to find out if certain elements are present.

You can then use the onboard GPS with the analyser and start creating contour maps of concentrations of the particular elements you are searching for before you even start to dig in an area.

PXRF analysers quickly deliver exploration data for quantitative geochemical analysis of metal concentrations for all types of mine mapping.

Again, you can then send that data to the field camp or the laboratory for easy collaboration and informed decisions.

The PXRF can help you map dangerous or previously inaccessible sites.

Portable handheld analysers can be operated virtually anywhere onsite and easily accommodate a wide variation of samples.

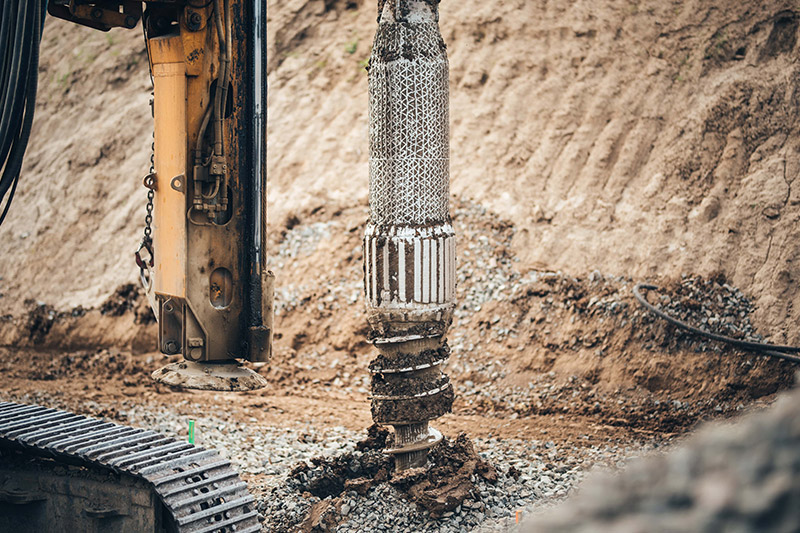
In The Drilling Phase

From a reverse circulation drill rig, your sample return can get you a read on any pathfinders or heat values.

This helps you decide whether to keep drilling or to stop drilling in an area.

The beauty of these samples is they are very homogenous.

Samples can be pre-screened with XL5 and you only need to send samples that have got known mineralisation back to the lab for testing. This can save you substantially, considering the lab costs involved.

Oil And Gas Exploration

XRF analysers are valuable for upstream exploration and production, offering rapid, onsite chemical analysis of rocks, cuttings, and cores that can be used for identifying formations and determining mineral composition of the rock.

Users can infer mineralogical properties favourable to oil and gas production from data collected in real time.

This provides qualitative and quantitative analysis for process and quality control, and rapid inspection and analysis ensures product chemistry specifications are met.

Portable options are lightweight and easy to use, delivering non-destructive analysis and lab-quality results in the field.

Mining exploration

What is geochemistry and why is it important?

Geology studies the structure of the Earth, whereas geochemistry is concerned with the chemical processes that occur in the formation of rocks and minerals.

Geochemistry is vital to our understanding of processes that produce economic concentrations of minerals whether by hydrothermal, magmatic, metamorphic, hydraulic (both surficial and subterranean) or weathering agents, or all of these.

Exploration geochemistry is a spatial sampling and analysis methodology used when searching for mineral resources and routinely for petroleum.

Geochemistry can also help us identify some of today’s most important environmental problems, such as global warming, ozone depletion, and soil and water pollution.

What Makes The Niton XL5 Plus So Special?

The Niton XL5 Plus offers the latest in technology, being the only 5 Watt system available, providing best limits of detection in the range. Plus it’s smaller, lighter, and even more ergonomic.

With it you can obtain geochemical data in seconds and in situ. It’s built for the most demanding analytical applications.

The XL5 Plus allows the x-ray source and fluorescence detector to be closer to the sample, improving limits of detection and shortening measurement time, especially for light elements.

As well as metals, the XL5 Plus measures the elemental composition of scale, sludge, oil, powders and slurries.

Other Key Features Of The XL5 Plus

  • Vivid navigation; customisable user profiles
  • Micro and macro cameras
  • Advanced analytical performance
  • Smaller, faster, lighter
  • Segment leading light element performance
  • Customisable for individual applications

A special mining mode lets users determine the concentration of elements from Mg to U in various types of geochemical materials.

How XRF Technology Works

XRF occurs when a fluorescent (or secondary) x-ray is emitted from a sample that is being excited by a primary x-ray source.

The detector is responsible for determining the elements present in a given sample by accurately and nondestructively “reading” the fluorescent x-rays.

When the characteristic x-rays enter the detector, their electromagnetic energies are converted to electrical pulses. These pulses are then sorted into element channels in a Digital Signal Processor (DSP).

Next, the “counts” from each element are sent to the microprocessor, which contains the algorithms for calculating the concentration of each element from the count rate data.

This makes it substantially advantageous in mining operations, because it provides immediate feedback and allows for quick decision making, including:

  • Whether to stop or continue drilling
  • When to make equipment relocation decisions
  • Where to focus on the grid
  • When to select a sample for laboratory analysis

Thinking about implementing XRF technology to your mining analysis or inspection process? Speak to our team of specialists at Portable Analytical Solutions to find out how the Niton XL5 Plus is best suited to you or your company’s needs.

Portable Analytical Solutions (PAS) offers multiple analysis options for your mining and exploration projects.

Related Resources:

Applications Of PXRF In The Field
XRF (X-Ray Fluorescence) Further Explained
Eureka! Portable XRF And Gold Exploration

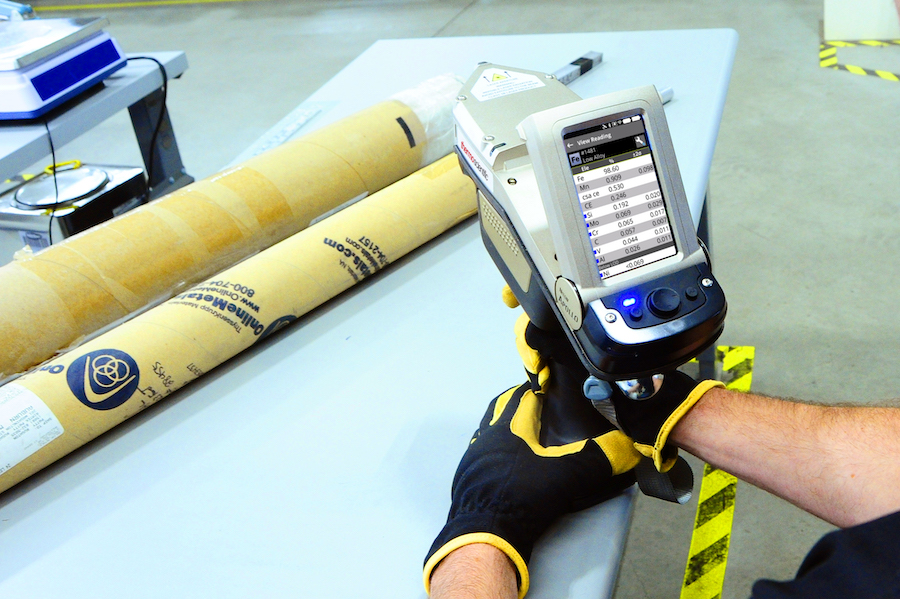
Niton™Apollo

Niton Apollo

Thermo Fisher ScientificLIBs

Laser focused carbon analysis.

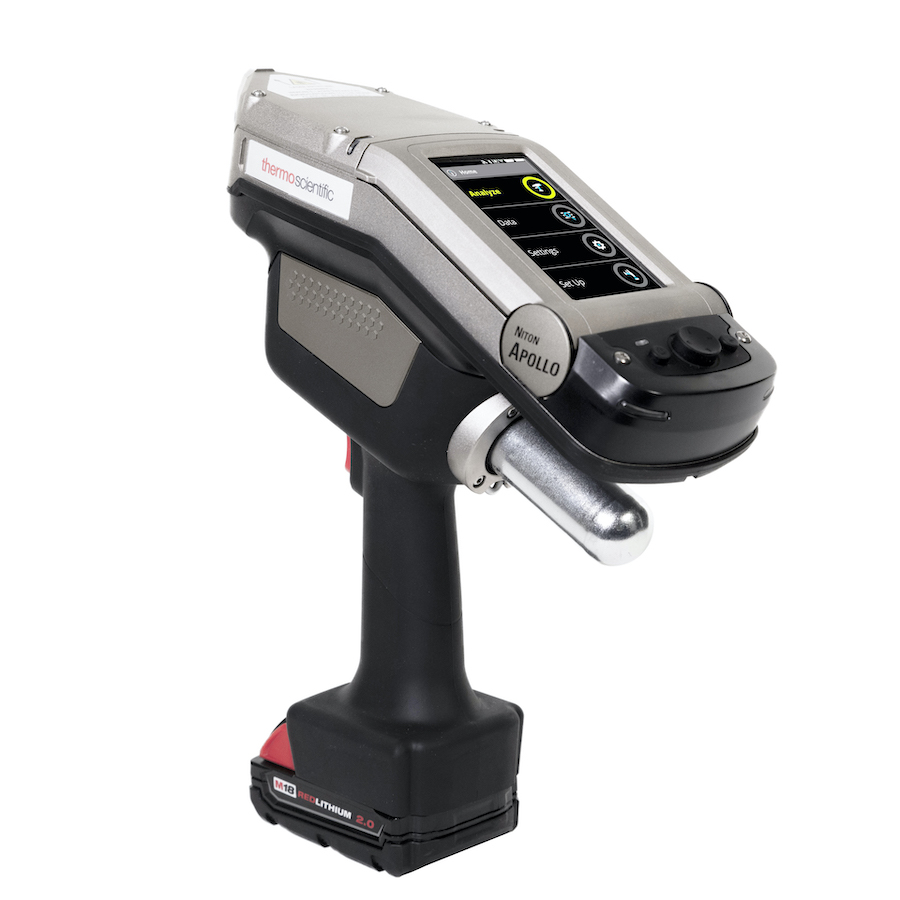
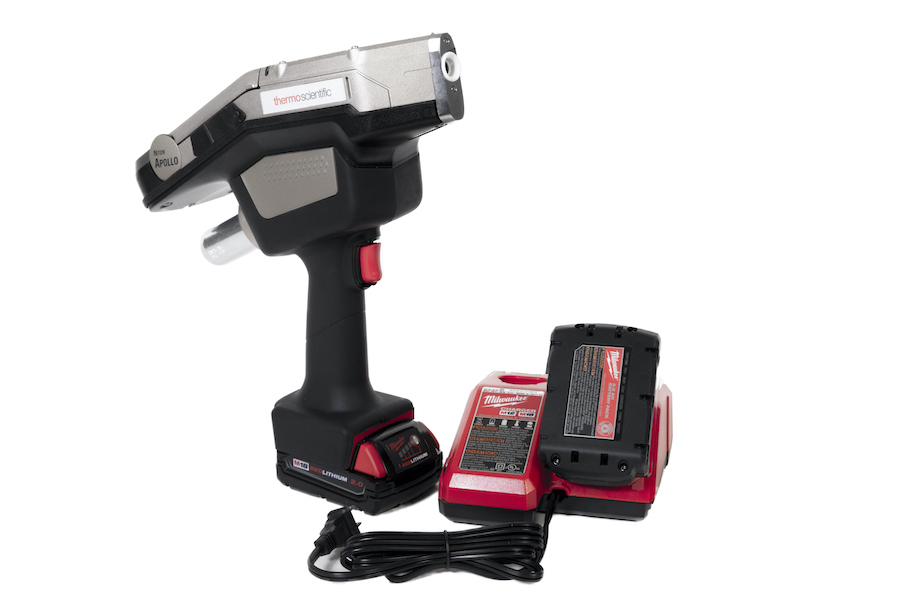
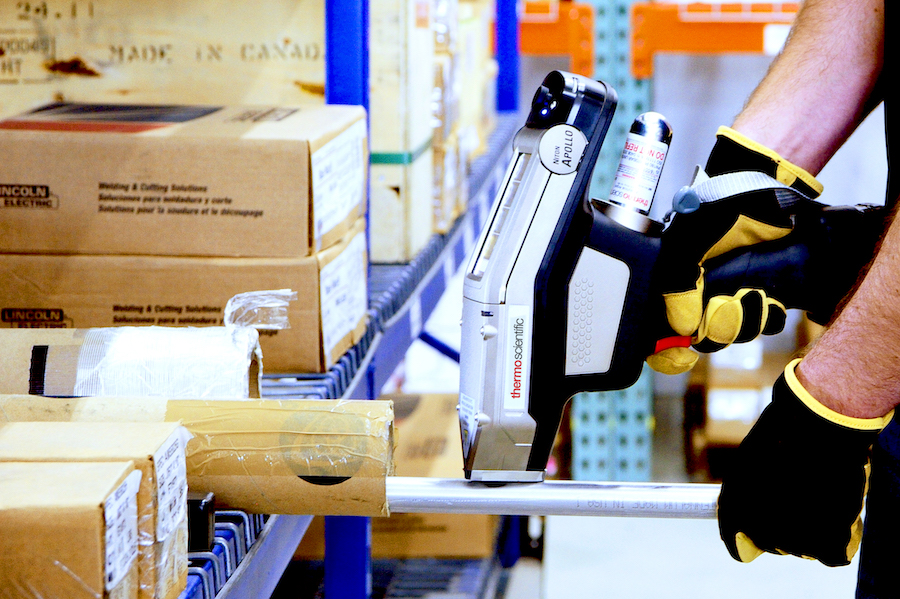
Discover high-speed performance combined with point and shoot simplicity. With minimal training, the Niton Apollo is easily operated even by non-technical users. Fast analysis times help increase sample throughput and production. A hot-swap Milwaukee® battery also keeps users up and running when it’s time to replace a low battery.

Niton™Apollo 8
Niton™Apollo 9

Designed to provide fast analysis and low detection limits, the Niton Apollo ensures superior results.

Engineered to help conquer your toughest analytical challenges, the Niton Apollo specialises in measuring carbon content in a convenient, portable form factor.

Powered by Laser Induced Breakdown Spectroscopy (LIBS), the Niton Apollo delivers unmatched speed, superior performance and enhanced productivity. Unleash the possibilities and bring the power of lab analysis to the field.

  • Determine alloy composition and grade for a wide range of metallurgical samples
  • Calculate carbon equivalency to determine piping weldability
  • Verify critical assets, such as, piping, valves and reaction vessels for Positive Material Identification (PMI)
  • Inspect materials at receiving, in-process fabrication and outgoing Quality Control (QC)
  • Validate Material Test Reports (MTR)
  • Prevent contaminated scrap from entering the supply stream 
  • Detect tramp and trace elements to meet regulatory standards

Key Applications for the Niton Apollo

Alloys / Metal Fabrication / Scrap Metal / Oil & Gas

Speak to PAS for expert guidance about the Thermo Fisher Niton Apollo

Demonstration Videos