Why does the world end at 2.5 micrometres?
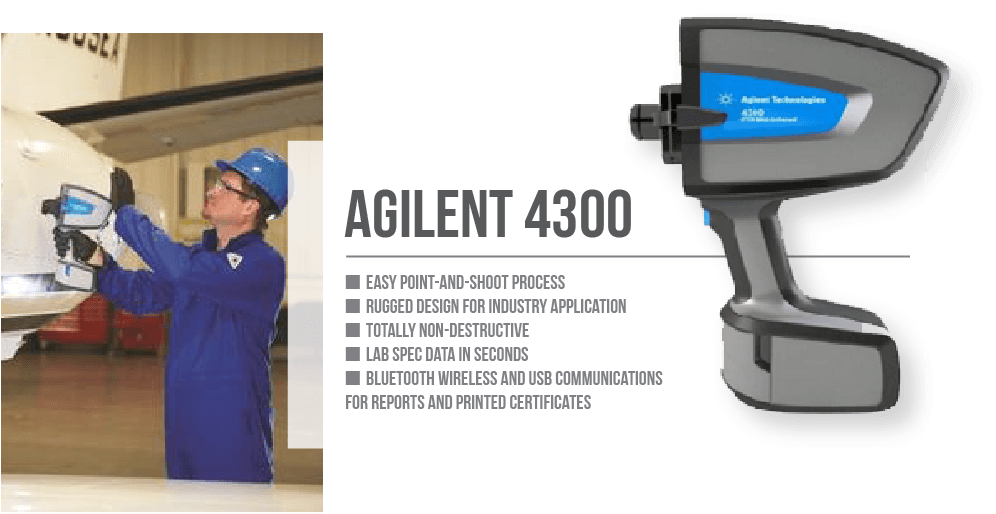
This informative article by Jon Huntington, consultant at Huntington Hyperspectral Pty Ltd and CSIRO Hon. Fellow, was published on LinkedIn.com on October 29, 2017. Portable Analytical Solutions provided an Agilent 4300 FTIR spectrometer loan unit, for the collection of spectra. We are proud to work with colleagues like Jon Huntington, and to be part of insights into this important field of study.
Why does the world end at 2.5 micrometres? Or more precisely, “Why does the SWIR mineral mapping world end at 2.5 micrometres“? It’s like some belief in a flat-earth that we should not venture beyond 2500 nm for fear of falling into a spectral darkness. This is not so because beyond 2500 nm spectroscopic richness and variety continues that can help us better unravel mineral mixtures and gather true full-wavelength mineralogical signatures from 400 to 15,000 nm (0.4 to 15 µm).
Furthermore if we want to equip a next generation National Virtual Core Library (NVCL-2) with ever more accurate descriptions of subsurface mineralogy, and even recognise more mineral content in mineral and basin systems, then we must learn to use the mid-infrared (MIR), along with the VNIR, SWIR and TIR already available.
For close-range core or chip logging, or contact field sample analysis, then there is no good reason for a 2.5 µm limit, other than history. It is primarily a hangover from the remote sensing world where one is limited by the absorption characteristics of the atmosphere. But provide your own sun and get closer then all those problems go away and stopping at 2.5 µm becomes a significant limitation. Sure to go beyond requires good quality detectors but that should no longer be an issue.
So geologists need to be doing their homework and setting the user requirements for hardware, AND algorithms and software, to open up this important wavelength region, the mid-IR (MIR) from 2.5 to 6 µm. In the mid-2000’s Australia pioneered operational, anhydrous mineral mapping in the thermal infrared (the TIR from 6.0-14.5 µm) with the NVCL-1 and should now be getting ready to join-up the SWIR and TIR by articulating why, geologically, we must fill the gap between 2.5 and 6.0 µm. And there are many good reasons.
Chief amongst these reasons is that many minerals have absorption characteristics in this MIR region that will help differentiate them when they occur in mixtures (which is usually) and will help us better model assemblages across the entire VNIR, SWIR, MIR and TIR regions: i.e. help reach the goal of “joint interpretation”. Let’s not also forget that the fundamental stretching vibration of OH-bearing minerals occurs in the MIR, near 2.7 and 2.8 µm. Furthermore it encompasses the region of CH-bond vibrations and all the opportunities that that opens up.
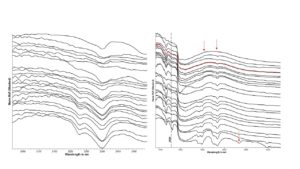
Let’s consider a few examples. We know that mixtures of, say, chlorite and carbonate +/- sericite can be hard to separate in the SWIR, especially when fractions are small. Sometimes the carbonate component can hardly be seen at all (Fig. 1). So we go to the TIR. However TIR carbonates can be severely compromised if the grain size is very fine. But by including the MIR region and the additional absorption features we get confirmation of the obvious carbonate component and any ambiguity is resolved.

Fig 1 – Left – A series of drill core spectra illustrating chlorite and epidote features at 2254 & 2340 nm. So how many of these spectra also indicate carbonate? Right – The same spectra expanded to cover the long wavelength end of the SWIR (up to the dashed line at 2500 nm) and the MIR and sorted by the depth of the 3974 nm (3.974 µm) carbonate absorption. This is one of several carbonate features (some paired) seen in the MIR near 3500, 3900, 4670, etc. (red arrows). The right-hand plot clearly shows that all samples, except two, contain carbonate, whereas on the left-hand plot it was unclear.
In a similar way separating chlorite, biotite and phlogopite can be even more challenging, but in this case the TIR doesn’t help as much and can often be ambiguous. The MIR, however, shows these three minerals have different characteristics and should make their separation that much easier. The banner image for this note shows a biotite spectrum with two diagnostic features at 2711 and 2822 nm.
Fig. 2 (below) shows the latter part of the SWIR (2000-2500 nm), the MIR and the TIR for a carbonate vein and illustrates the many valuable MIR carbonate features, as well as quality TIR carbonate features.

Fig. 3 on the other hand (below) shows a spectrum from the same core interval but with subdued SWIR absorption, highly distorted TIR carbonate features (red arrows) caused by very fine grain size, but still quite usable carbonate features in the MIR.

So the MIR adds extra wavelengths, increased clarity in unravelling mineral mixtures and difficult situations, and the chance to model smaller fractions.
Fig. 4 below (courtesy of Andy Green) reminds us of the different absorption / scattering processes that apply as a function of sensing wavelength and it is gratifying that the MIR is largely a region of volume scattering and thus like what we are used to in the SWIR, and unlike the surface scattering we experience in the TIR. Note that for this example we should certainly be continuing our sensing to 5 µm.

What is required to move all this MIR opportunity forward? The instrument engineers are already looking at plugging this mid-IR region and the CSIRO/NVCL community have been talking about it internally for a couple of years, and indeed built a prototype. But we really need to accelerate our preparations, especially in building the geological arguments for investment in this area, in building the spectral reference libraries and, crucially, adapting our TSG algorithms and software to meet the challenge. All this cannot be left until after the technology is out there. It must go on in parallel and it will take vision, homework, collaboration and commitment. Let’s do it!
